
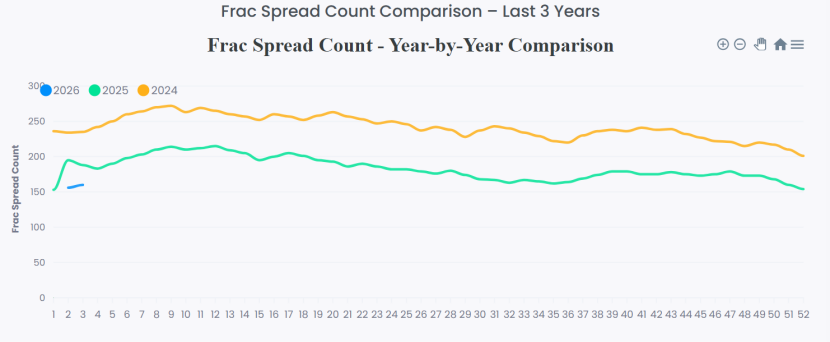
Monday Macro View shows that U.S. completion activity started the week on firmer footing. Primary Vision’s frac spread count rose to 160, continuing the gradual recovery seen through mid-January, while the frac job count also moved higher, reinforcing the picture of improving utilization rather than a return to excess capacity. The data points to a completion environment that is becoming steadier after a soft end to last year, with activity concentrating where operators can execute efficiently without committing to large expansions in equipment.
Source: EFRACS - Primary Vision
Recent public comments from Harold Hamm about potentially pausing drilling in the Bakken have drawn attention to margin pressure at current oil prices. Our data, however, suggests a more nuanced adjustment. While drilling plans may be reassessed at the margin, completion activity in the Williston Basin has held up and stabilized after a strong rebound earlier in 2025. From there, it is important to place U.S. activity in the context of how oil prices are moving. This week, Brent slipped to around $64 per barrel, while WTI is trading at $60 (as I write this), as expectations of rising U.S. crude inventories dominated market sentiment.
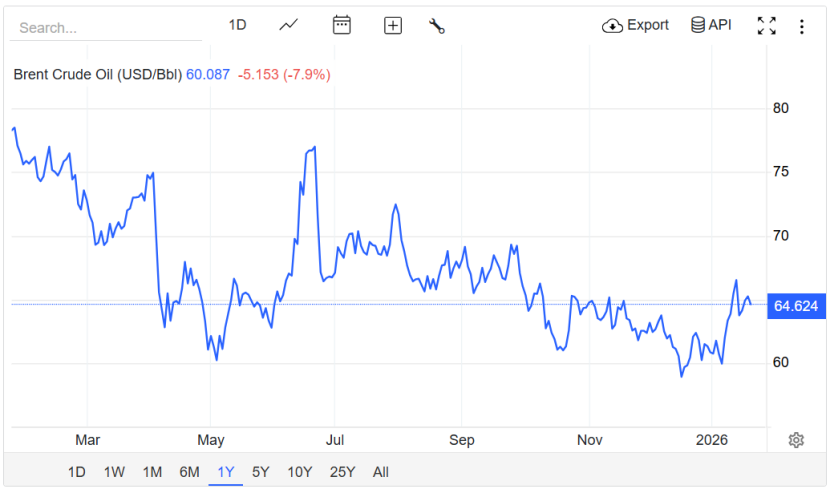
Temporary supply outages in Kazakhstan, which may last seven to ten days, and stronger Chinese economic data provided short-lived support, but these factors were outweighed by the prospect of a near-term stock build of roughly 1.7 million barrels. Futures markets are signaling that traders continue to view supply-side disruptions as manageable in the absence of sustained demand acceleration.
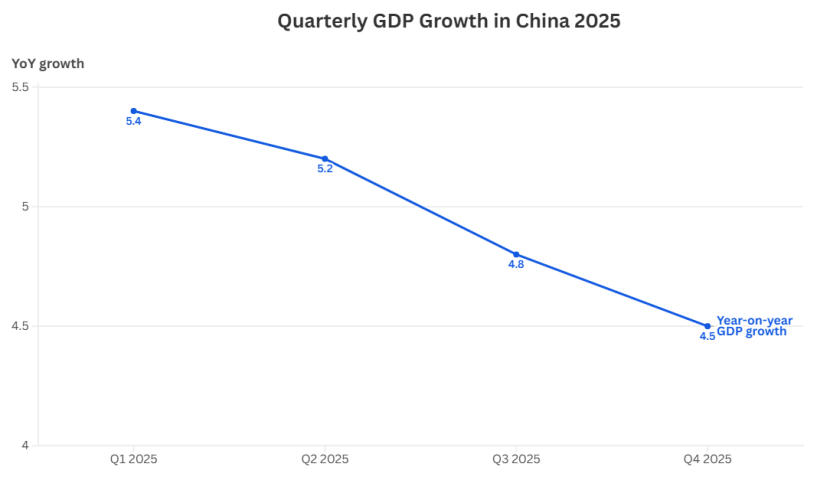
Geopolitical risks are adding complexity rather than clear direction. While the issue of Greenland may have gone into the background (for a while), the possibility of renewed U.S.–Iran tensions remains a background support for prices. U.S. has started to move a “massive” fleet towards Iran. The net effect has been steady downward pressure on prices rather than a sharp repricing of risk.
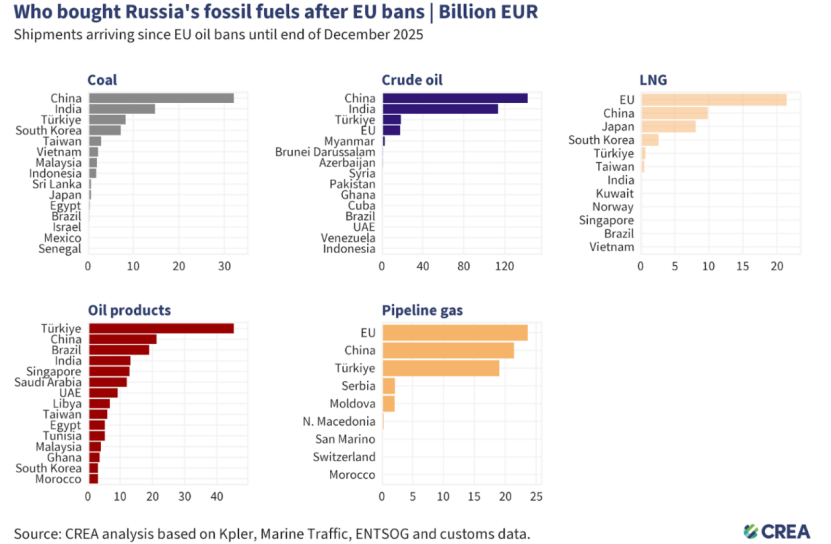
At this point, it is useful to turn to Russian oil and gas flows, which help explain why supply remains ample despite sanctions. In December, Russia’s fossil fuel export revenues slipped only marginally, declining 2% month on month to roughly EUR 500 million per day, one of the lowest levels since the invasion of Ukraine but still substantial in absolute terms. Crude oil export revenues fell more sharply, down 12% to EUR 198 million per day, driven by a 16% drop in seaborne crude revenues to EUR 139 million per day, while pipeline crude revenues edged higher to EUR 59 million per day. These declines were partially offset by increases in LNG revenues, which rose 13% to EUR 48 million per day, and pipeline gas revenues, which increased 17% to EUR 70 million per day.
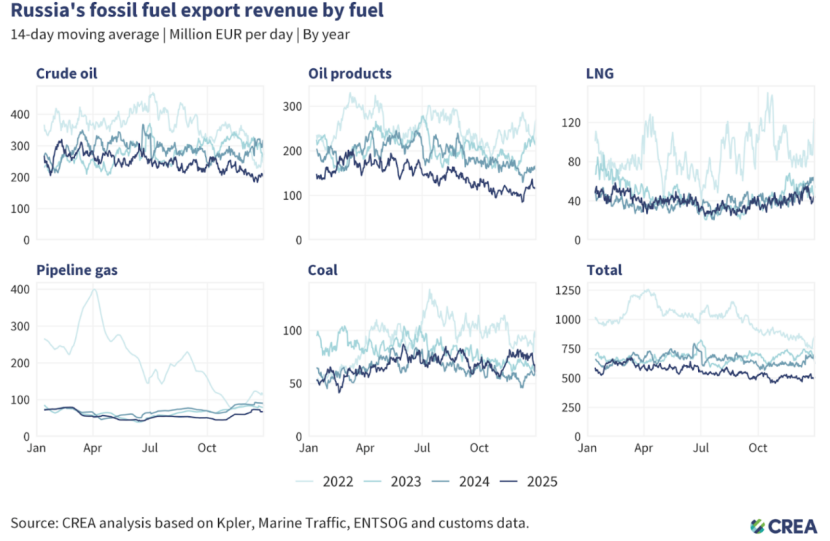
Who is buying these barrels also matters. China remained the largest single buyer, accounting for 48% of Russia’s export revenues from the top five importers in December, with total purchases of around EUR 6 billion, of which crude oil represented roughly 60%. China’s seaborne crude imports from Russia increased 23% month on month, with ESPO volumes reaching their highest level in four months. In contrast, India reduced Russian crude purchases by 29% month on month, cutting volumes to their lowest level since the price cap was implemented, led by a 49% reduction at the Jamnagar refinery and a 15% cut by state-owned refiners. Turkiye displaced India as the second-largest buyer, importing about EUR 2.6 billion of Russian hydrocarbons, dominated by refined oil products and pipeline gas, even as its crude imports from Russia fell 33%.
Overall we are seeing commodities performing well - gold, silver touching new highs and natural gas at $5! This trend benefits some (the producers and traders) while negatively impacts those who import. It means if the current upside in commodities continue that will put further pressure on emerging economies, already under stress from sky high public debts, political problems and economic issues.
Concluding with the same point from where we started - if there is further upside to oil prices. If situation in Middle East gets serious. We may see prices getting further boost which in turn will provide more impetus to U.S. frac’ing activity. As the frac data indicates, completion activity remains resilient, suggesting that near-term production will continue to be supported.