






Articles
- BLOG / Articles / View
- Articles
Beyond Frac: Why One Metric Is No Longer Enough
By Avik on August 7, 2026 in Articles
Different Questions Produce Different Answers
One of the most common questions we receive from investors is deceptively simple: Why do completion datasets sometimes tell different stories?
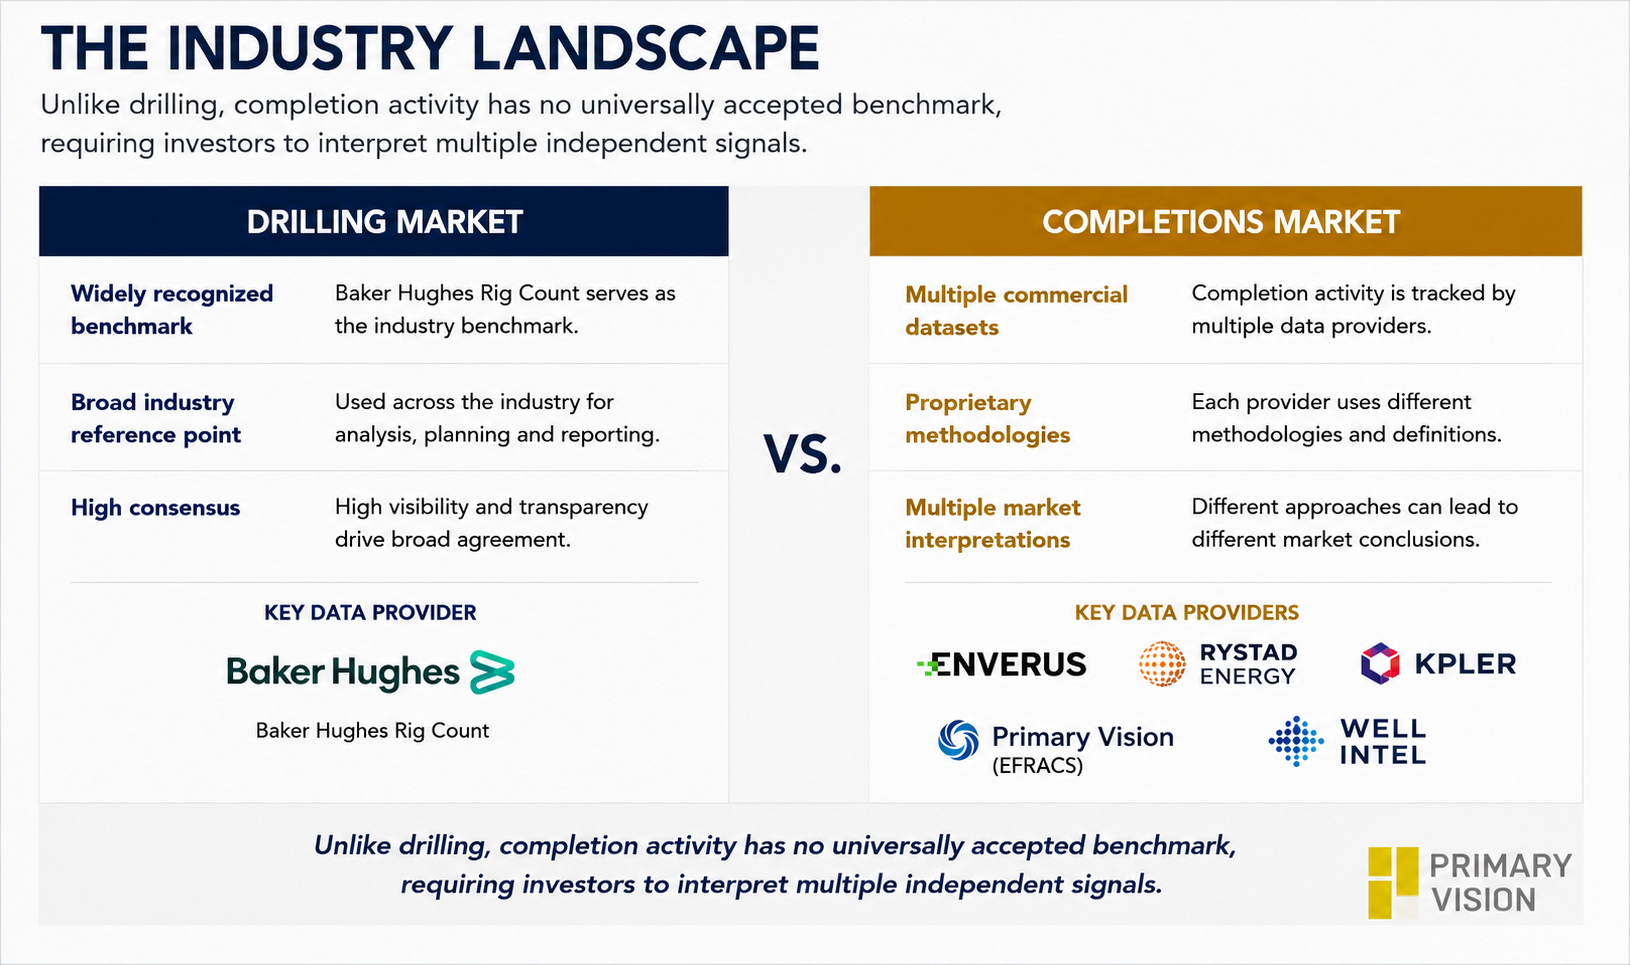
The answer lies less in data quality than in the question each provider is trying to answer. Today's upstream intelligence platforms measure drilling, production, infrastructure, well activity and completions through different operational lenses. Different methodologies naturally produce different market interpretations.
That distinction has become increasingly important as the completion market has evolved. Fleet counts alone no longer explain activity as effectively as they once did. Productivity, execution and basin participation have become equally important drivers of the completion cycle.
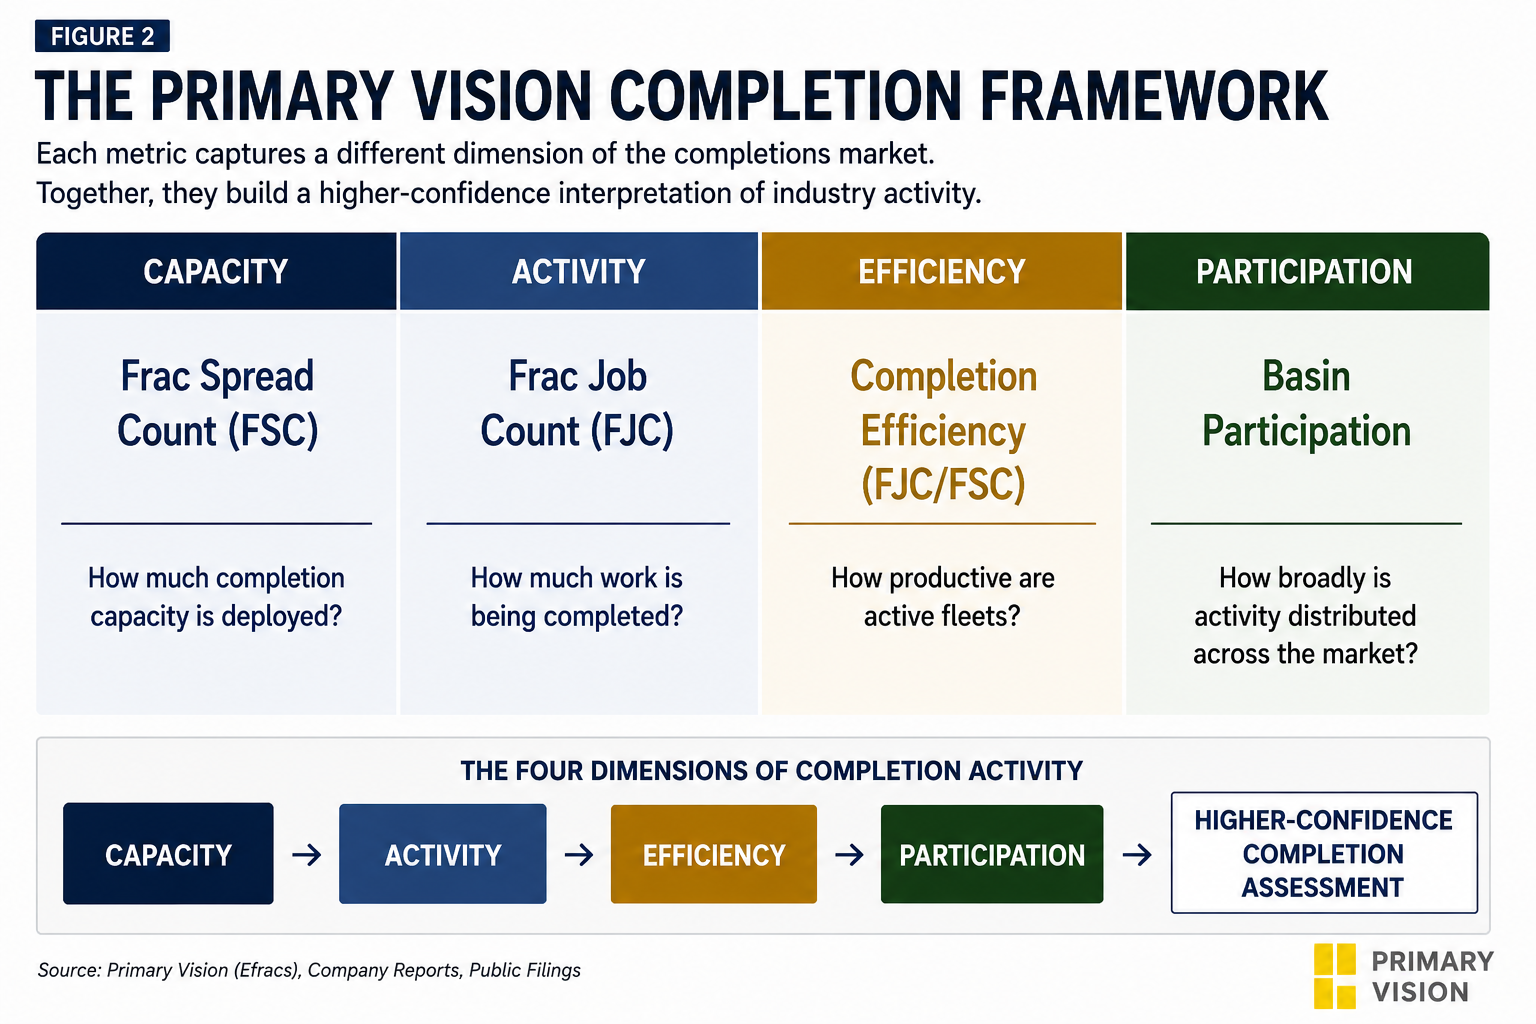
This is where Primary Vision's framework differs. Rather than relying on a single activity measure, it evaluates the market across four dimensions: capacity, activity, efficiency and participation. Together, these metrics provide a more complete view of completion activity than any individual dataset can offer.
Capacity Tells One Story. Efficiency Tells Another.
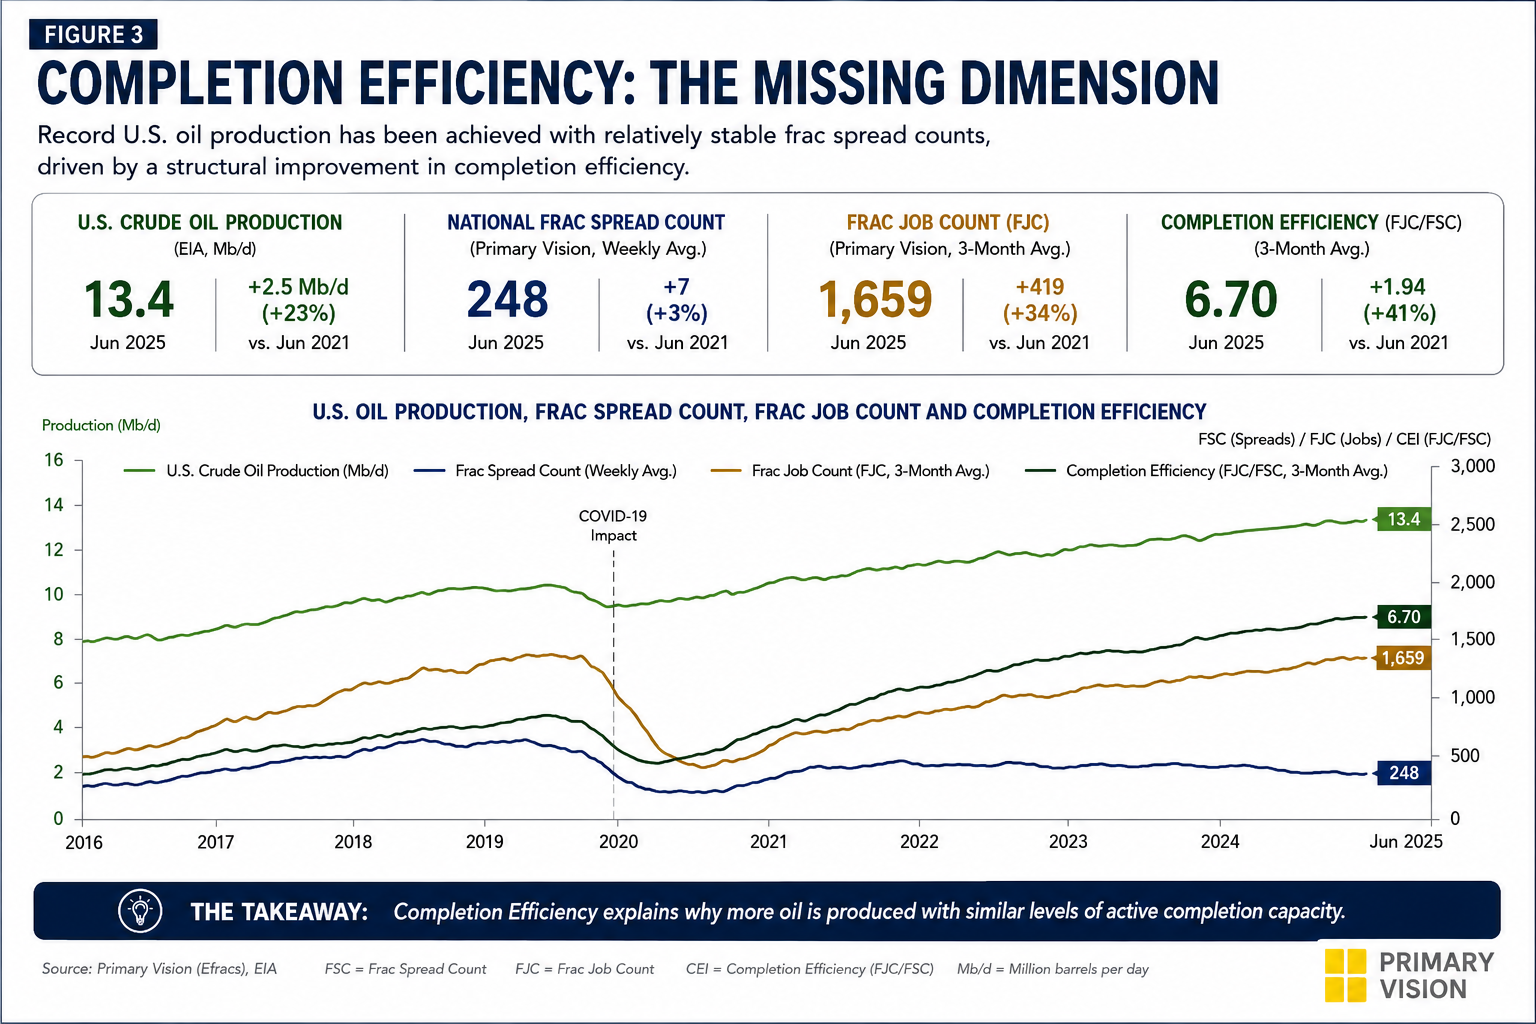
National Frac Spread Count averaged approximately 248 active spreads during the first half of 2025, remaining remarkably stable despite record U.S. crude oil production. Viewed in isolation, the data suggests a mature completion market with little appetite for another cycle of fleet expansion.
The picture changes when Frac Job Count is introduced. Primary Vision's Frac Job Count increased from roughly 1,230 jobs in 2021 to approximately 1,659 jobs in 2025, an increase of nearly 35%, while deployed spread counts changed little. Existing fleets were simply completing more work.
Primary Vision captures this relationship through the Frac Efficiency Index (FEI).
Frac Efficiency Index (FEI)
FEI = Frac Job Count ÷ National Frac Spread Count
Measured as completed jobs per active spread.
FEI increased from approximately 4.8 jobs per spread in 2021 to nearly 6.7 jobs per spread in 2025, an improvement of almost 40%. The implication is straightforward: the completion market is becoming more productive without adding meaningful fleet capacity.
The Missing Link Between Completion and Production
The production data reinforces that conclusion. While FEI increased nearly 40%, U.S. crude oil production continued to reach record highs even as Frac Spread Count remained broadly range-bound. Historically, that level of production growth would have required significantly more active fleets.
Instead, Primary Vision's data points to a more productive completion market. Longer laterals, higher stage density, improved execution and modern pressure pumping technologies are enabling operators to generate more completed work from essentially the same deployed fleet base. FEI therefore bridges the gap between stable fleet counts and continued production growth, providing a clearer measure of how operational productivity is reshaping the completion cycle.
Does Weather Risk Matter?
Historical analysis suggests weather has a smaller impact on deployed completion capacity than commonly assumed. Major Gulf Coast hurricanes have not produced a measurable weekly decline in Western Gulf Frac Spread Count, while August has not consistently delivered a national seasonal increase in activity. As a result, the relatively quiet 2026 Atlantic hurricane outlook lowers disruption risk but does not alter Primary Vision's base Frac Spread Count forecast.
Extreme summer heat may still create localized delays lasting several days or up to two weeks, but these disruptions are likely to remain within the normal operating range unless they become widespread across multiple basins. Any weather-related impact is therefore more likely to appear in Frac Job Count, Frac Efficiency Index (FEI), stages completed, and operating hours than in Frac Spread Count itself. We will deal with the issue in greater detail in the next part of the series.
Final Commentary
There is no single metric that defines today's completion market. Capacity, activity, efficiency, and participation each tell a different part of the story.
Primary Vision's framework brings these dimensions together through Frac Spread Count, Frac Job Count, Frac Efficiency Index (FEI) and basin participation, providing a more complete view of the North American completion cycle. The remainder of this series explores how each dimension offers new insight into industry performance.
Tags:
Permission denied
Upgrade to Pro Today and get…
• This article — plus dozens more each month, all within our full Research Module
• Frac Hits — our National-Level Frac Spread Count and Frac Job Count, updated weekly
• Frac Operator Monitor — detailed FSC & FJC by operator
• And so much more, designed to help you track, forecast, and outperform