Shale Activity in 2026: Tracking The Basin and Operator Movements
By
Avik
on October 14, 2026
in
Articles
Regional Activity Is Diverging
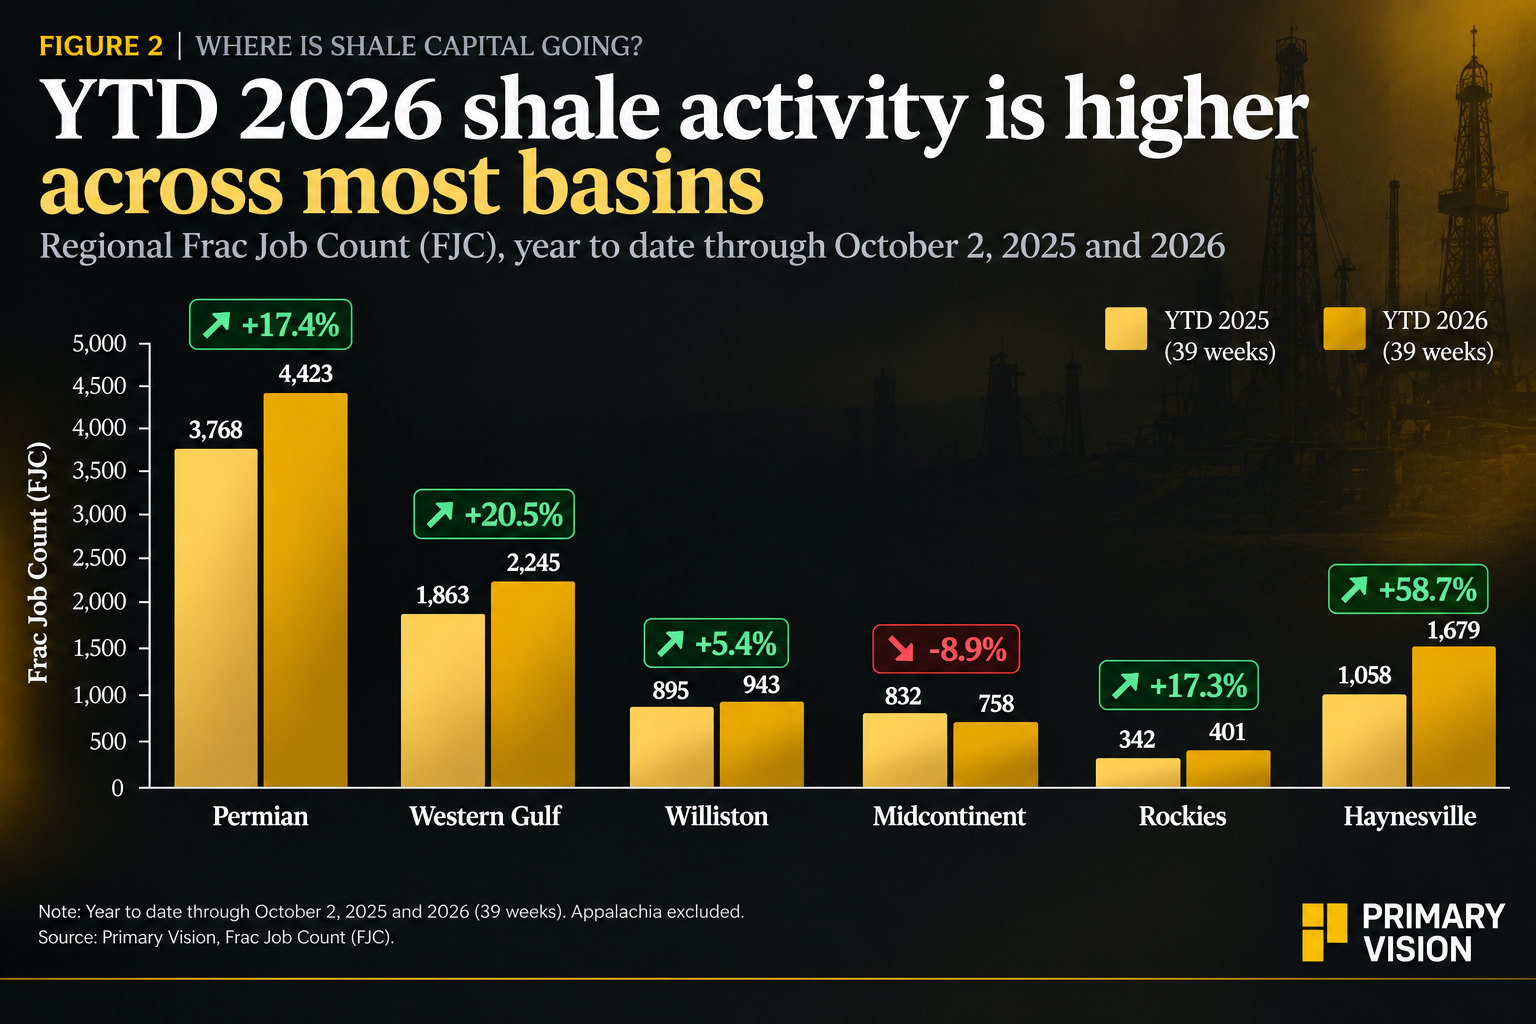
Regional frac activity weakened in five of the six basins covered by the analysis during January–August 2026, while Haynesville bucked the trend. The Permian, Western Gulf, Williston, Midcontinent and Rockies all recorded lower FJC year over year. Appalachia remains excluded because its regional data could not be reconciled confidently with operator-level records.
The divergence suggests that shale activity is not moving uniformly. The Permian remains the largest activity center in this group, while Haynesville is benefiting from a different development backdrop, including potential LNG and data-center demand. These factors provide context, but do not establish direct causation.
Company strategies add another layer. ExxonMobil continues to integrate Pioneer and deploy technology to support production growth, while Devon emphasizes capital efficiency and free cash flow. In Haynesville, Comstock has highlighted LNG and data-center opportunities, though near-term activity remains sensitive to gas prices.
Operator Activity: Different Strategies, Different Results
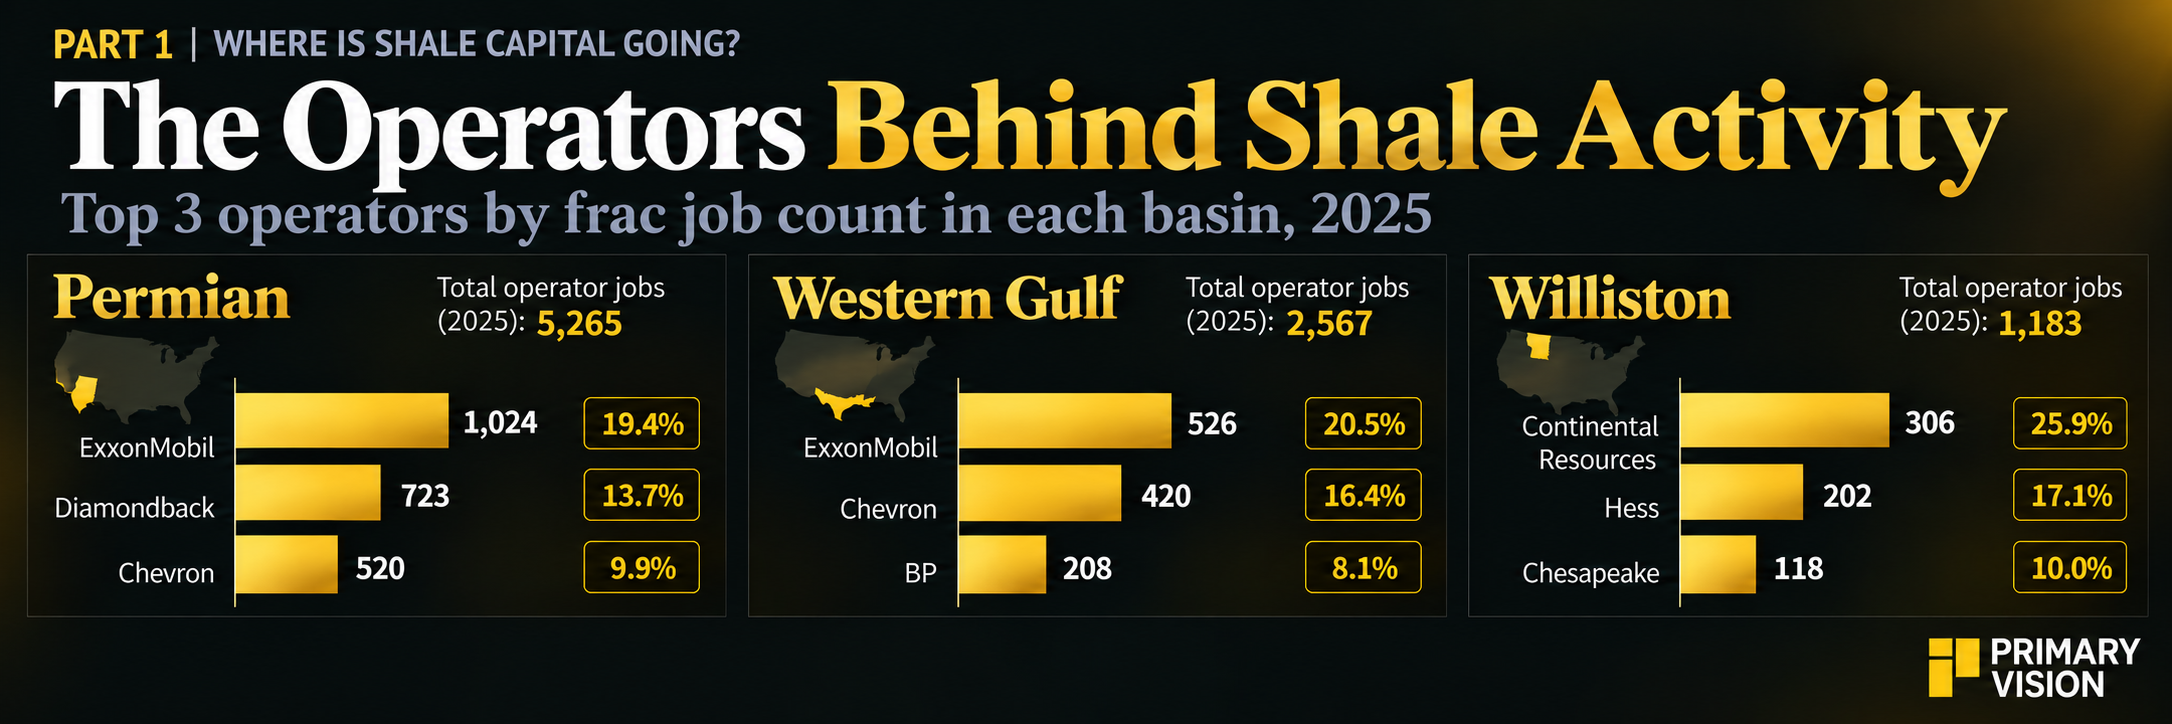
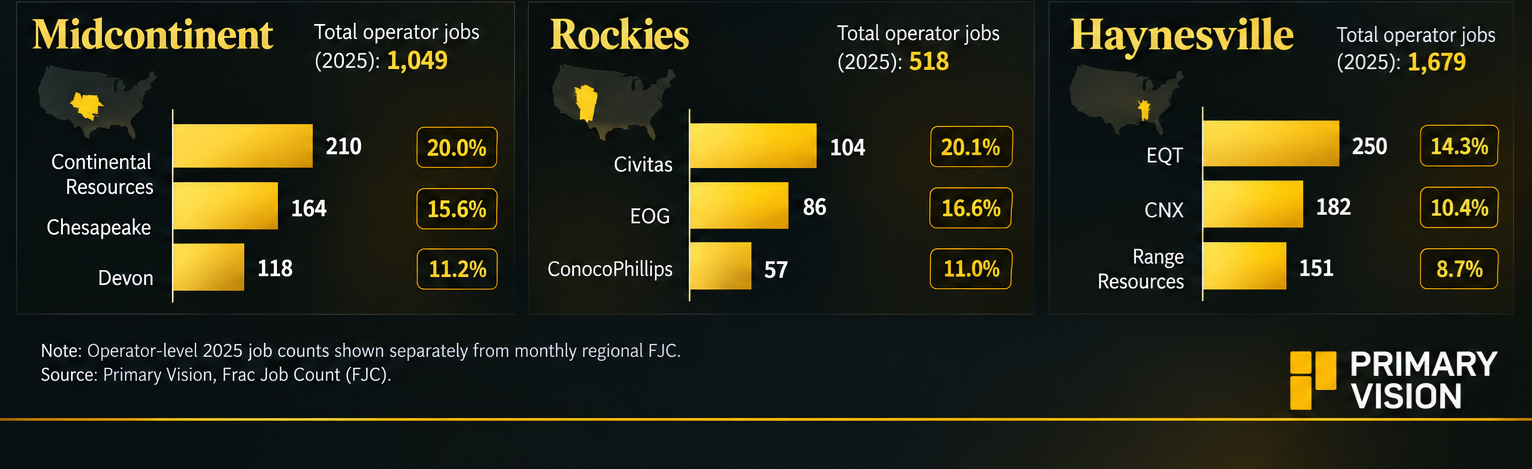
Operator-level data tells a separate story. Devon’s recorded frac jobs increased during the first nine months of 2026, while Diamondback’s declined. EOG’s recorded decline requires caution because the workbook flags coverage concerns in specific areas.
These differences do not necessarily conflict with the regional trend. Operators can outperform or underperform the basins where they operate, and data coverage can affect the comparison. Reliable, like-for-like records are essential before drawing conclusions.
What Is Driving the Changes?
Activity reflects more than capital spending. Commodity prices, development priorities, acquisitions and operational efficiency can all influence completion schedules.
Comparing capex with frac jobs—and examining management commentary—can help explain these differences. But lower job counts do not automatically mean lower spending or weaker execution, just as more jobs do not necessarily indicate greater capital efficiency.
The Takeaway
Regional activity is diverging, with Haynesville moving against the broader trend. Operator-level data adds detail, but coverage limitations matter. The next step is to connect reliable activity records with comparable capex data and management’s stated priorities before drawing conclusions about what is driving the changes.
Upgrade to Pro Today and get…
• This article — plus dozens more each month, all within our full Research Module
• Frac Hits — our National-Level Frac Spread Count and Frac Job Count, updated weekly
• Frac Operator Monitor — detailed FSC & FJC by operator
• And so much more, designed to help you track, forecast, and outperform