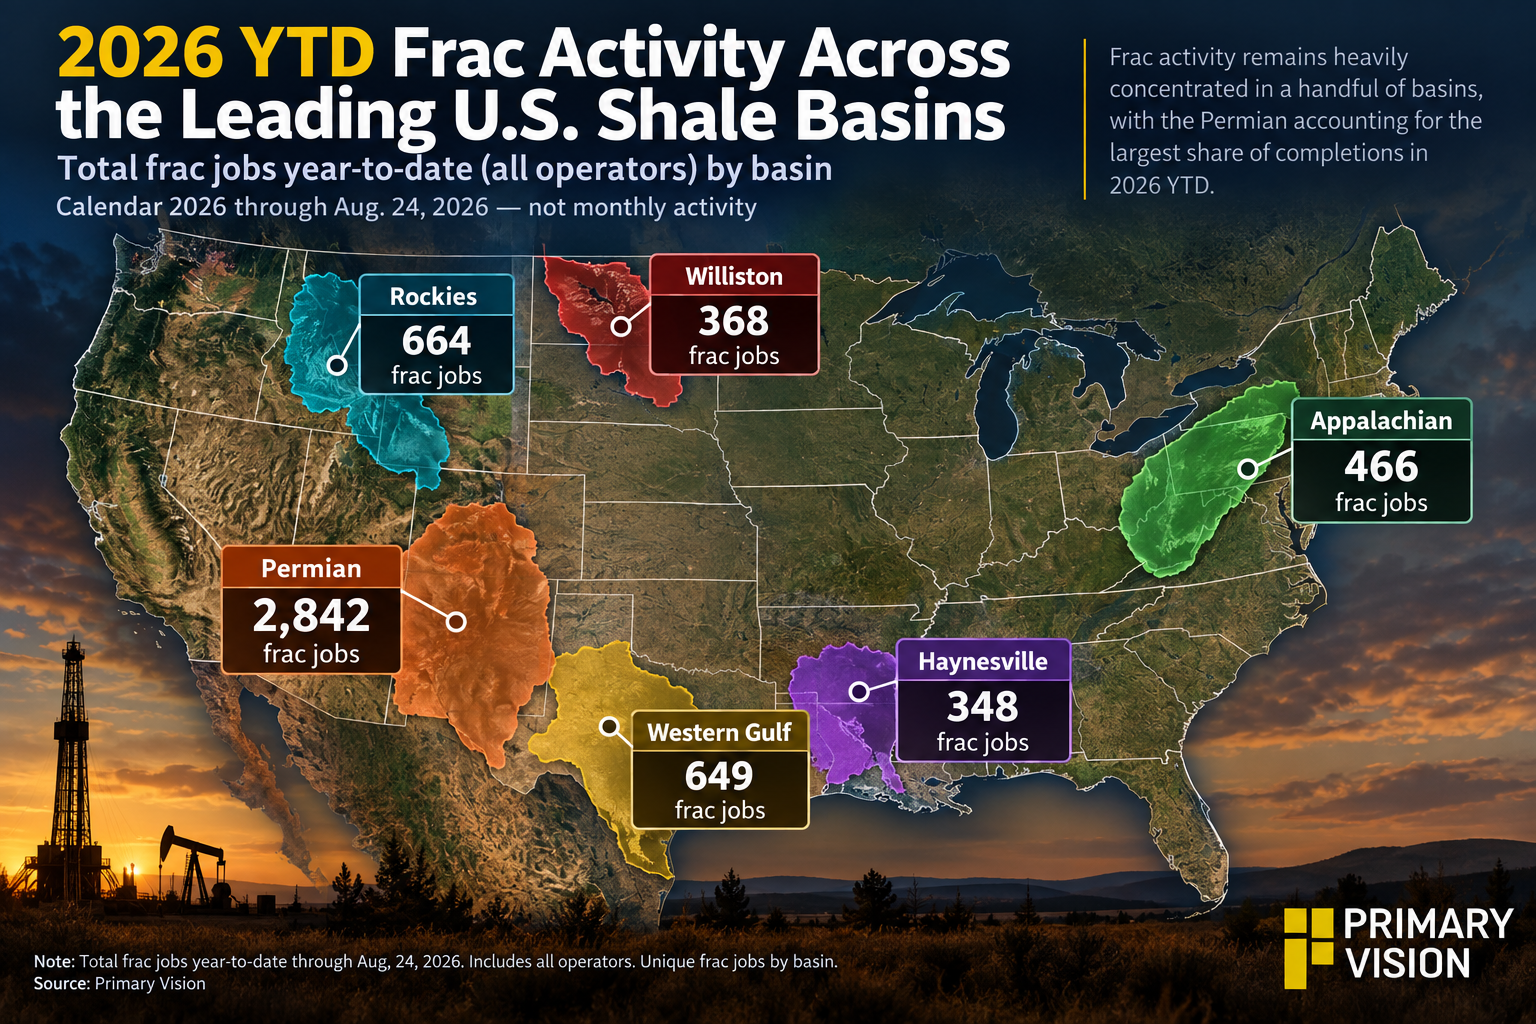
Frac activity remains heavily concentrated in a handful of U.S. shale basins. Primary Vision's 2026 year-to-date data shows the Permian is the clearest example, accounting for 55% of the frac jobs across the six leading basins in the dataset. The remaining activity is more evenly distributed, with the Rockies, Western Gulf and Appalachia each contributing roughly 9%-13%, while Williston and Haynesville together account for another 14%.
A high number of frac jobs can reflect an operator's development program, but it does not tell us how much acreage, inventory or future production sits behind those jobs. We will also explore some of these in Part 2 of this series.
Activity Is Not The Same As Scale
The data shows where operators are completing wells. It does not, by itself, establish production share, inventory depth or corporate scale.
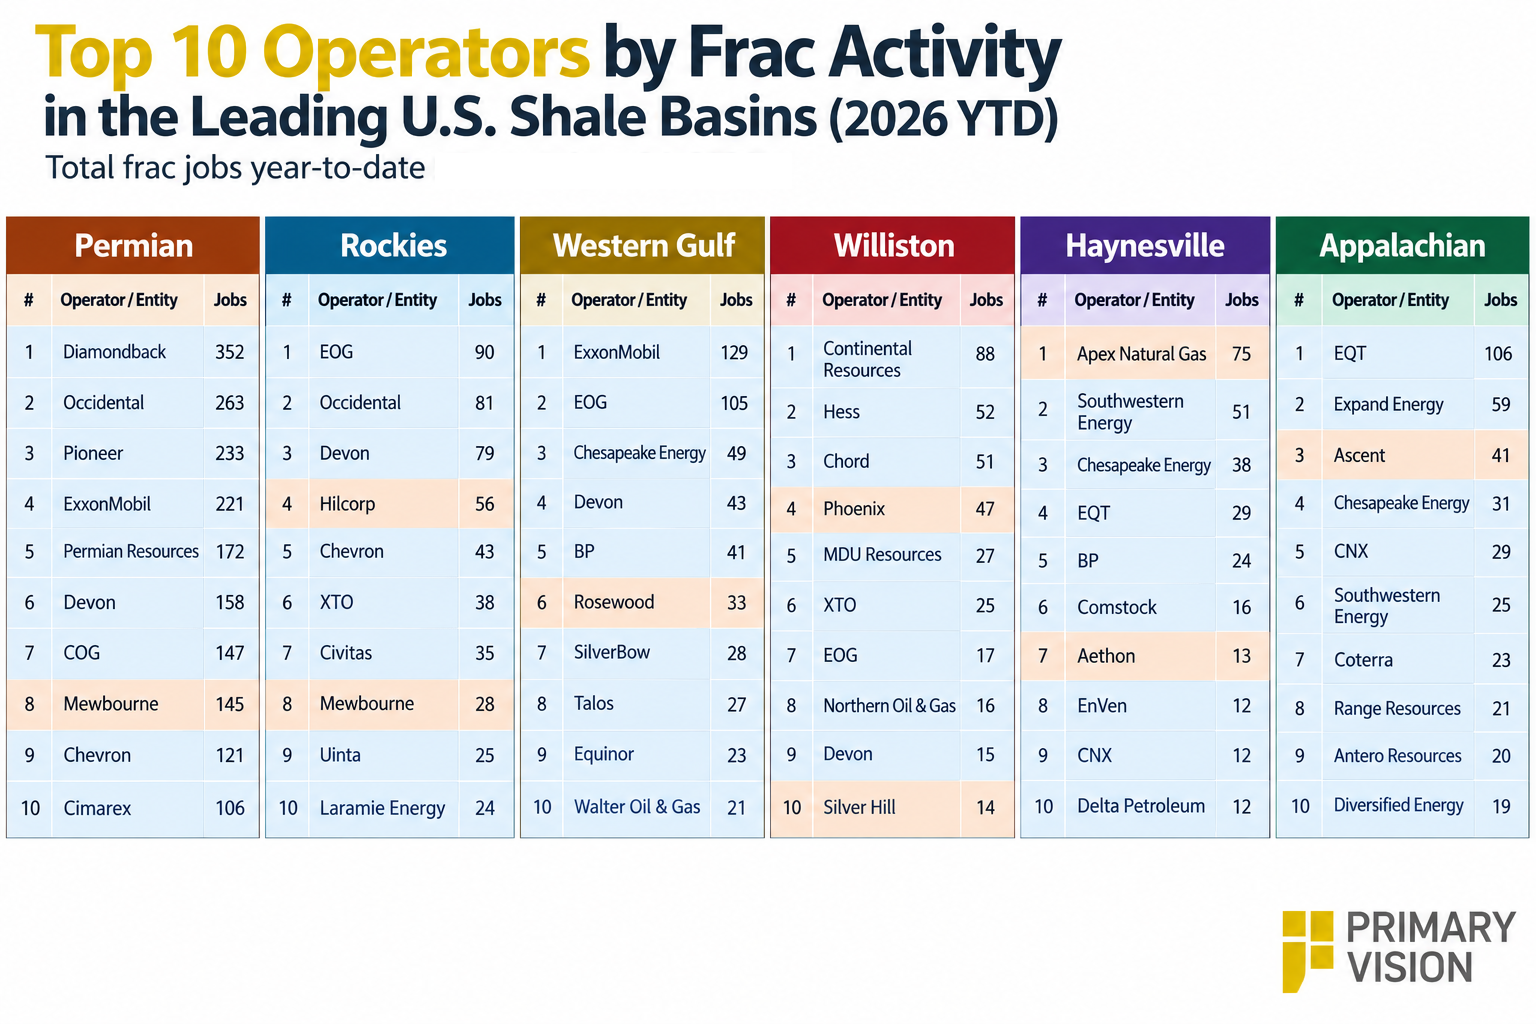
That distinction is particularly important because the frac dataset retains operator-level entities. Some of those entities are now subsidiaries of larger companies or have been absorbed through acquisitions. Pioneer, for example, remains an identifiable operator in the frac records, while its production is now included within ExxonMobil's reporting. The same issue applies to other legacy entities.
Private Operators Remain Visible
The basin totals tell only part of the story. Looking at individual operators shows that private companies continue to appear prominently in the completion data.
Mewbourne ranked eighth in the Permian with 145 frac jobs. In the Rockies, Hilcorp ranked fourth with 56 jobs, while Rosewood ranked sixth in the Western Gulf with 33. Phoenix ranked fourth in the Williston with 47 jobs, and Ascent ranked third in Appalachia with 41.
Haynesville provides another example. Apex Natural Gas ranked first with 75 frac jobs, while Aethon recorded 13 jobs and entered the updated top-10 list.
What The Data Actually Shows
The basin mix reflects different economic drivers. Permian and Williston activity is primarily oil-driven, while Haynesville and Appalachia are more closely tied to natural-gas demand, LNG growth and pipeline capacity. The Western Gulf sits between the two, with the Eagle Ford offering both oil and gas exposure and strong Gulf Coast infrastructure.
That makes frac activity more than a measure of operator activity. Commodity economics, infrastructure, well inventory and expected returns ultimately determine which basins operators choose to complete.
Frac-job counts are therefore useful for identifying who is active and where activity is occurring. They are less useful for determining who controls production or possesses the greatest operating optionality. That requires bringing production and corporate scale into the analysis — which is where Part 2 should begin.
Upgrade to Pro Today and get…
• This article — plus dozens more each month, all within our full Research Module
• Frac Hits — our National-Level Frac Spread Count and Frac Job Count, updated weekly
• Frac Operator Monitor — detailed FSC & FJC by operator
• And so much more, designed to help you track, forecast, and outperform