





Articles
- BLOG / Articles / View
- Articles
THE GEOGRAPHY OF U.S. SHALE
By Avik on July 9, 2026 in Articles
Geography Is Becoming a Competitive Advantage
U.S. shale is no longer expanding evenly across every producing basin. Instead, completion activity is becoming increasingly concentrated within a relatively small group of counties where operators continue to find the strongest economic returns.
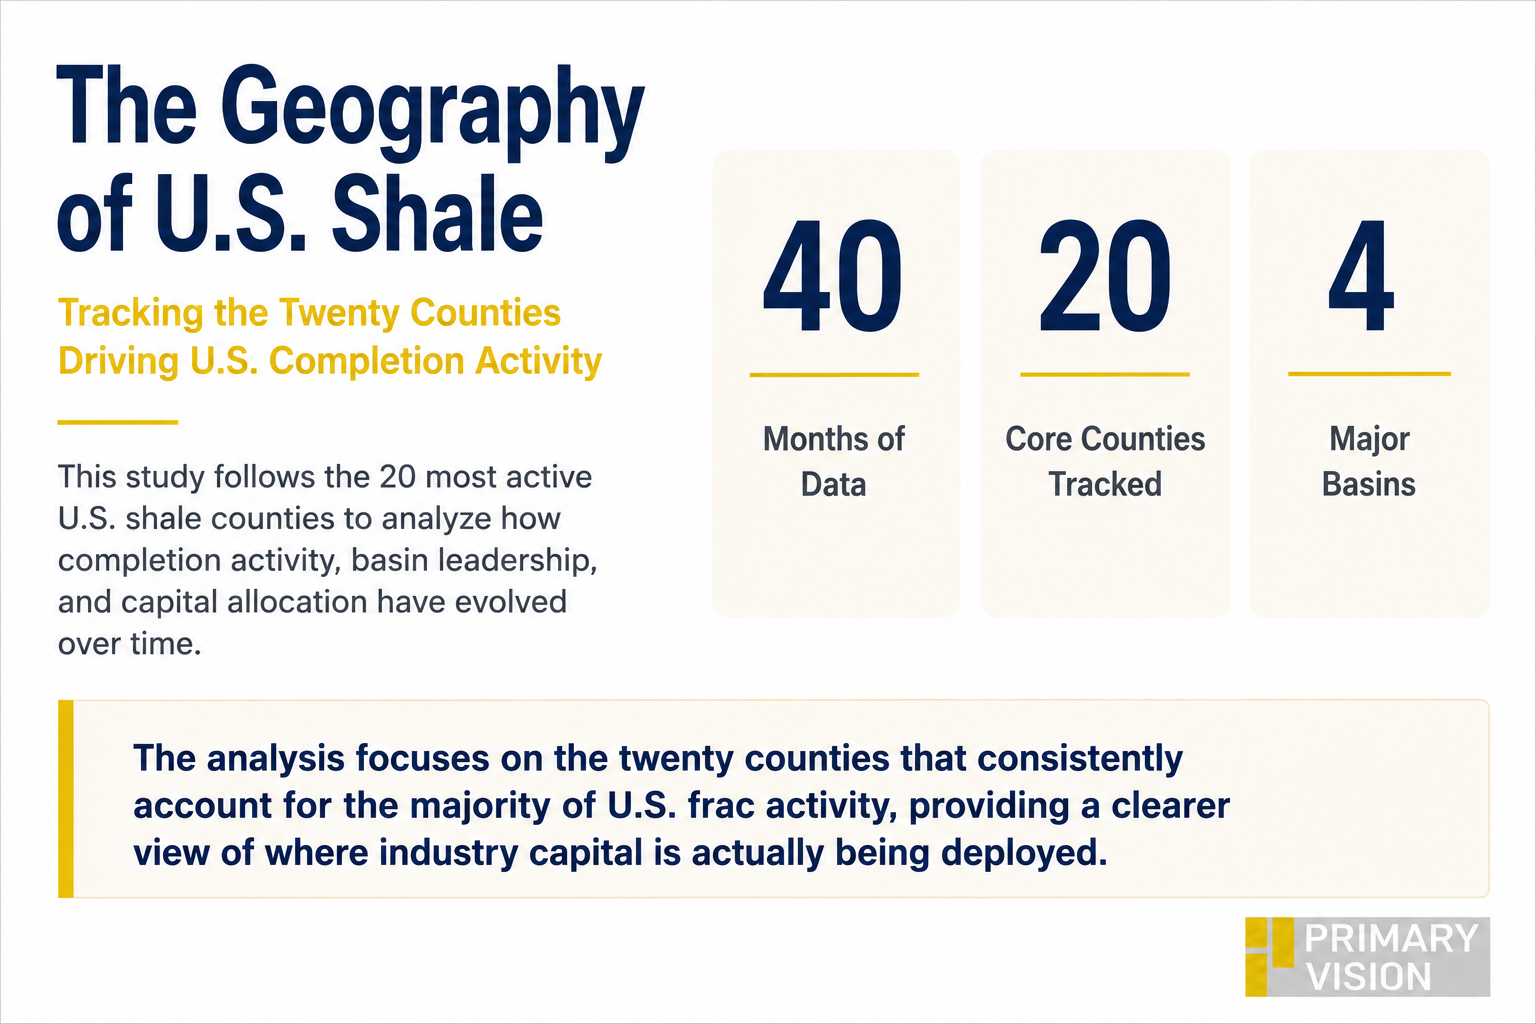
Primary Vision's county-level database tracks completion activity across twenty core shale counties, representing twenty-seven unique counties between January 2023 and April 2026. Rather than measuring basin-wide averages, the dataset captures where frac crews are actually completing wells. That perspective reveals a structural shift that traditional basin analysis often overlooks.
National completion activity has remained relatively stable over much of the study period, yet its geographic distribution has changed considerably. Operators are repeatedly deploying completion activity within the same counties, suggesting that acreage quality—not simply commodity prices—is increasingly determining where capital is deployed.
The Industry Is Becoming More Concentrated
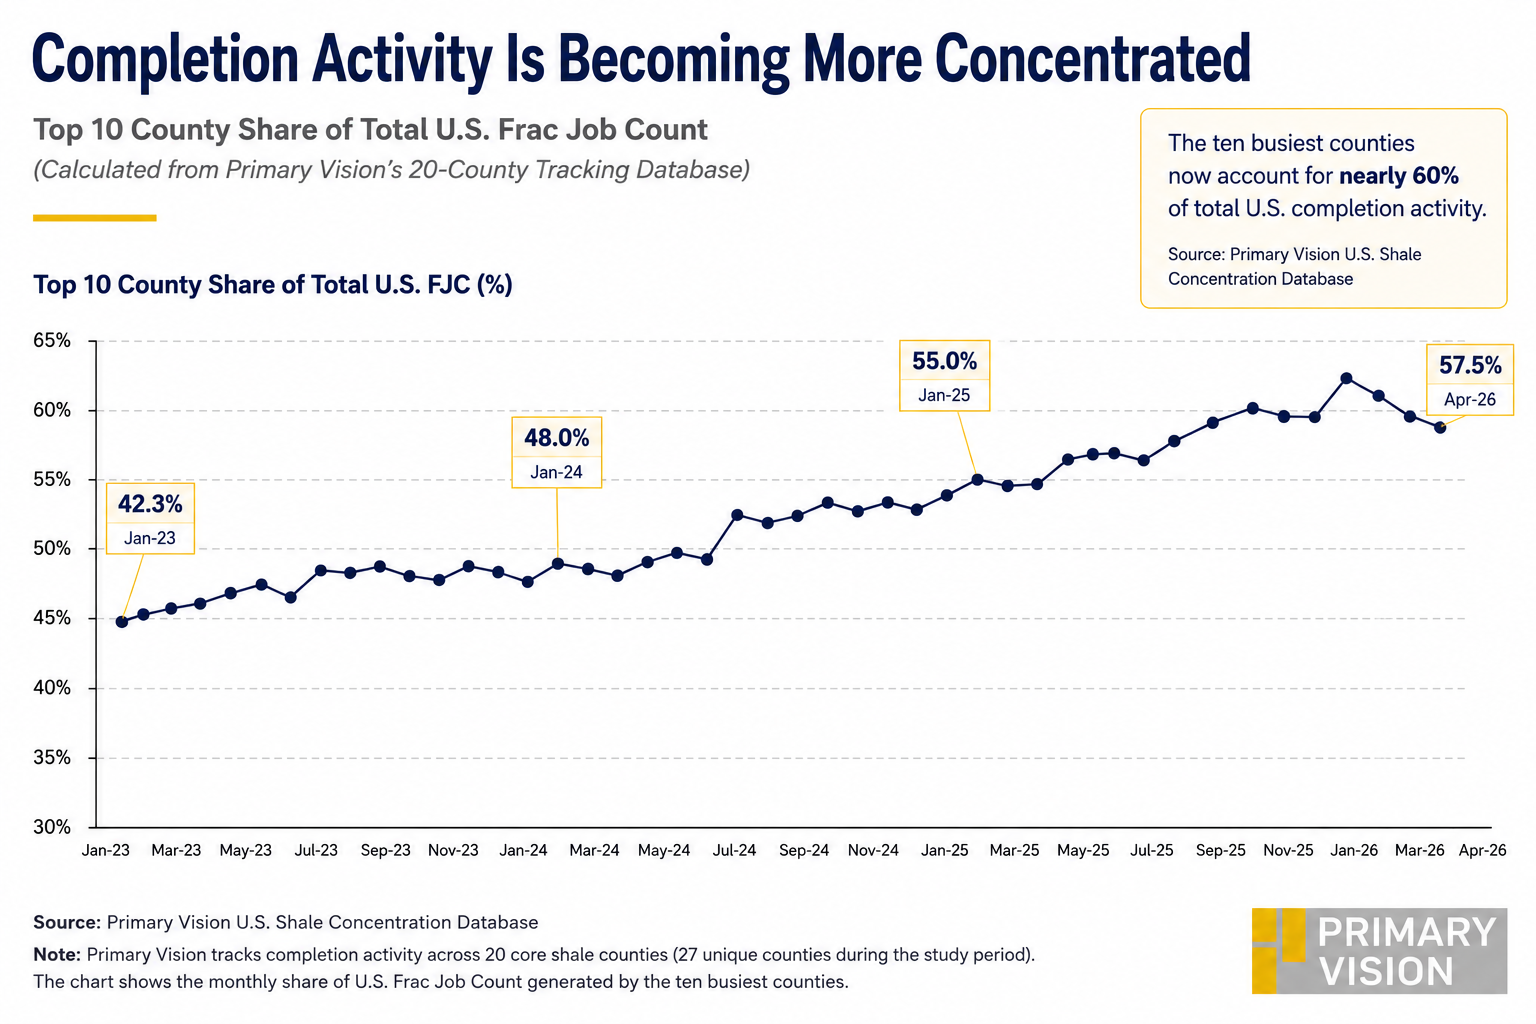
The concentration ratio has increased materially over the past three years. The ten busiest counties increased their share of total U.S. Frac Job Count from 42.3% in January 2023 to 57.5% in April 2026, while briefly exceeding 60% during late 2025 and early 2026. Importantly, this increase occurred without a comparable rise in national completion activity. Instead, it reflects a redistribution of activity toward a smaller group of counties, suggesting that operators are becoming increasingly selective in where they deploy completion capital.
Several structural changes help explain this trend. First, public operators have shifted from production growth to free cash flow generation, directing investment toward their highest-return acreage rather than expanding across broader leaseholds. Second, industry consolidation has combined large contiguous acreage positions, allowing operators to drill longer laterals and optimize development across core areas.
Finally, existing infrastructure—including gathering systems, processing facilities, water networks, and pressure pumping capacity—reduces development costs within established producing regions, reinforcing the advantage of already-active counties.
Not Every County Is Benefiting Equally
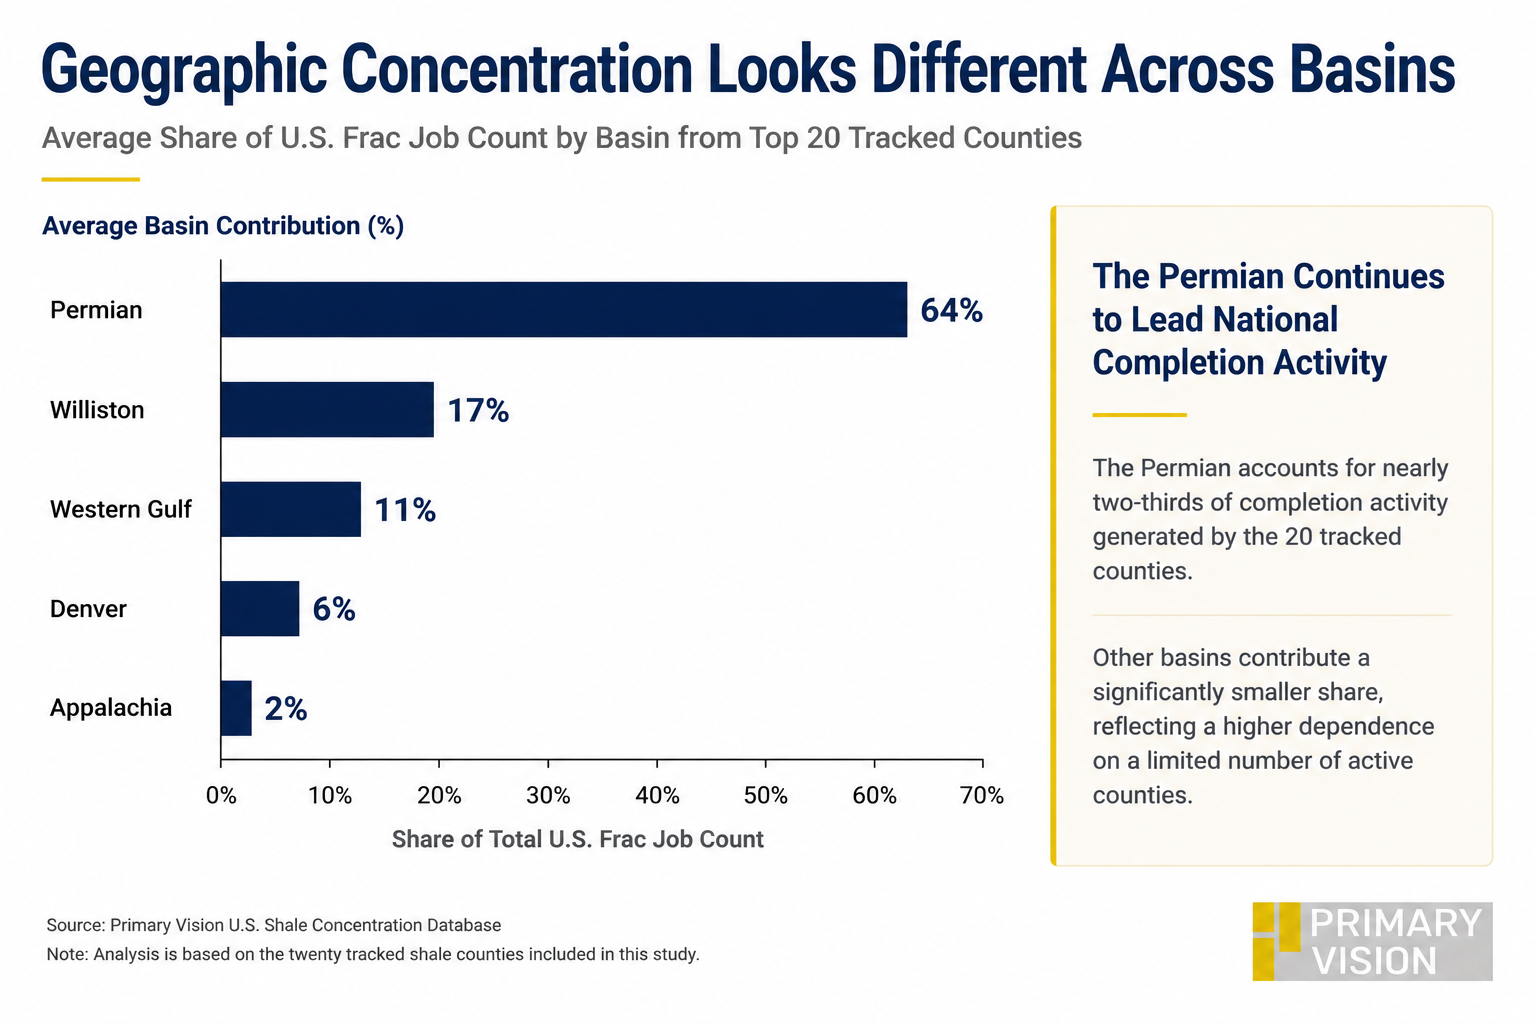
The Permian dominates the tracked county universe, accounting for nearly two-thirds of average completion activity during the study period. However, the data also shows that leadership is becoming increasingly concentrated within the basin itself.
Lea and Eddy Counties remain the industry's most active completion markets, supported by the Delaware Basin's thick stacked reservoirs, abundant Tier 1 inventory, and extensive midstream and service infrastructure. Midland and Martin Counties continue to anchor activity within the Midland Basin, while Reeves remains one of the basin's largest long-lateral development areas.
Outside the Permian, counties such as Weld and McKenzie continue to generate meaningful activity but represent a much smaller share of national completions than they did during earlier phases of the shale boom.
This divergence reflects differences in resource quality, inventory depth, infrastructure maturity, and corporate capital allocation. Mature basins with limited Tier 1 inventory increasingly compete for investment against the Permian's larger, contiguous resource base, making it progressively more difficult to maintain market share.
Investor Takeaway
The data suggests that the next phase of U.S. shale will be defined less by which basin grows and more by which counties continue to attract development. As operators concentrate activity within their highest-quality acreage, geographic positioning becomes an increasingly important competitive advantage.
For investors, this changes the analytical framework. Basin exposure alone is no longer sufficient. Companies with acreage, infrastructure, or service operations concentrated in counties such as Lea, Eddy, Midland, Martin, and Reeves are positioned to capture a disproportionate share of future completion activity. Conversely, businesses with greater exposure to peripheral counties may face slower activity growth even if overall basin fundamentals remain constructive.
The county-level trends establish the geographic framework. Our second part of this short series builds on this analysis by mapping operator exposure to the industry's highest-activity counties.
Tags:
Permission denied
Upgrade to Pro Today and get…
• This article — plus dozens more each month, all within our full Research Module
• Frac Hits — our National-Level Frac Spread Count and Frac Job Count, updated weekly
• Frac Operator Monitor — detailed FSC & FJC by operator
• And so much more, designed to help you track, forecast, and outperform