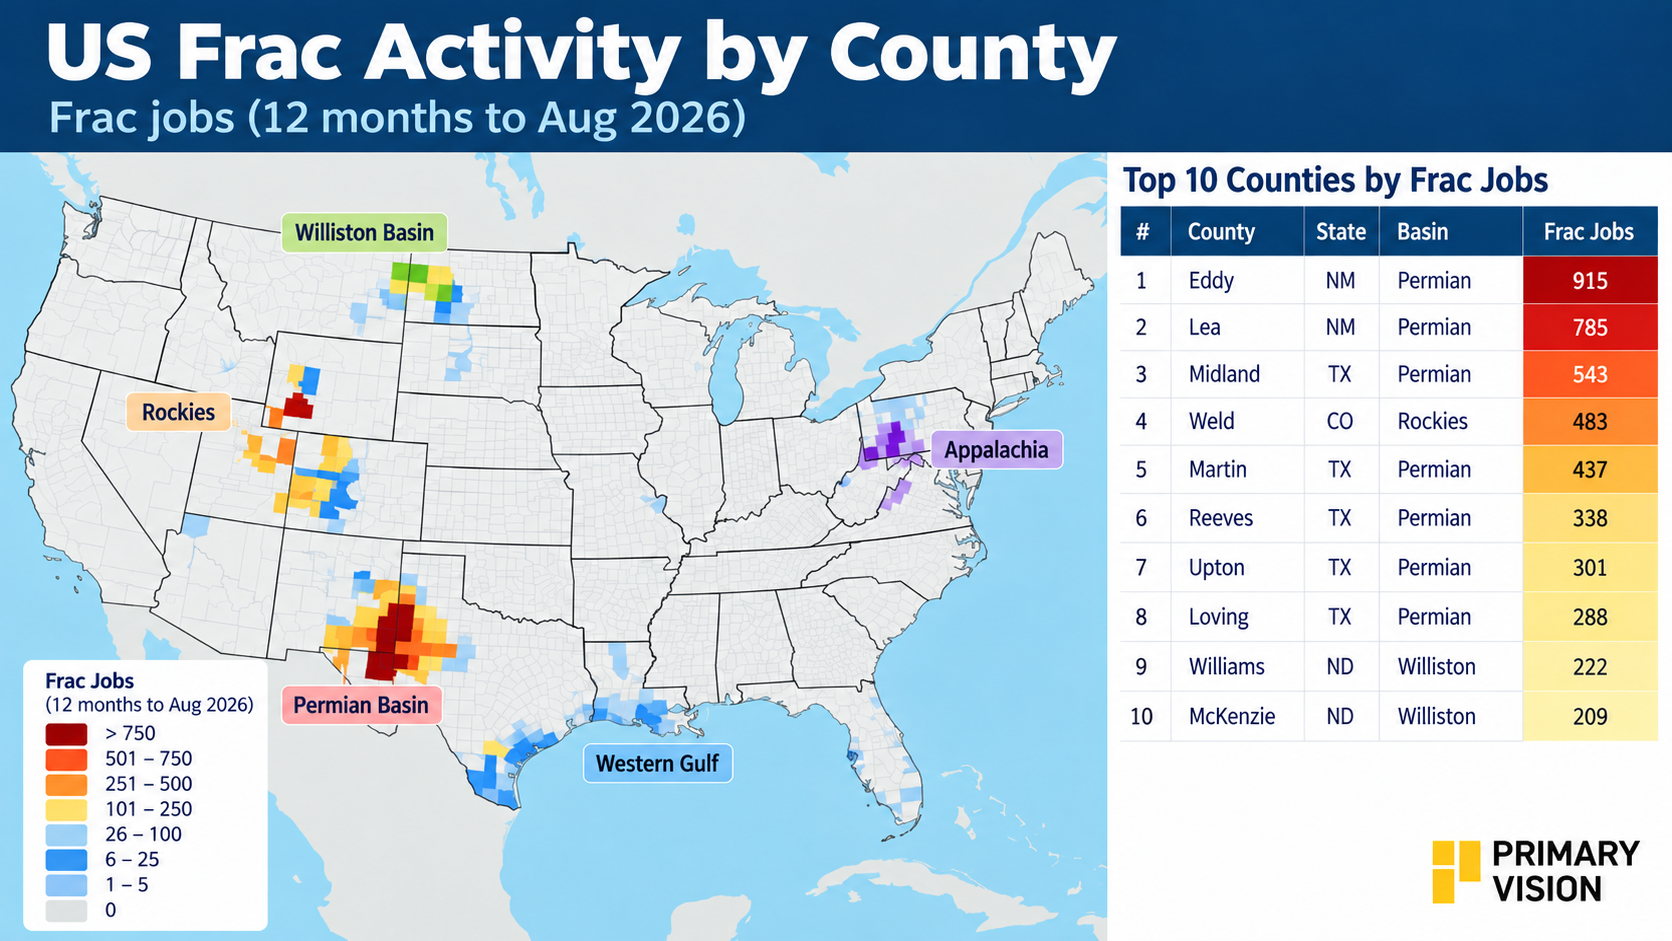
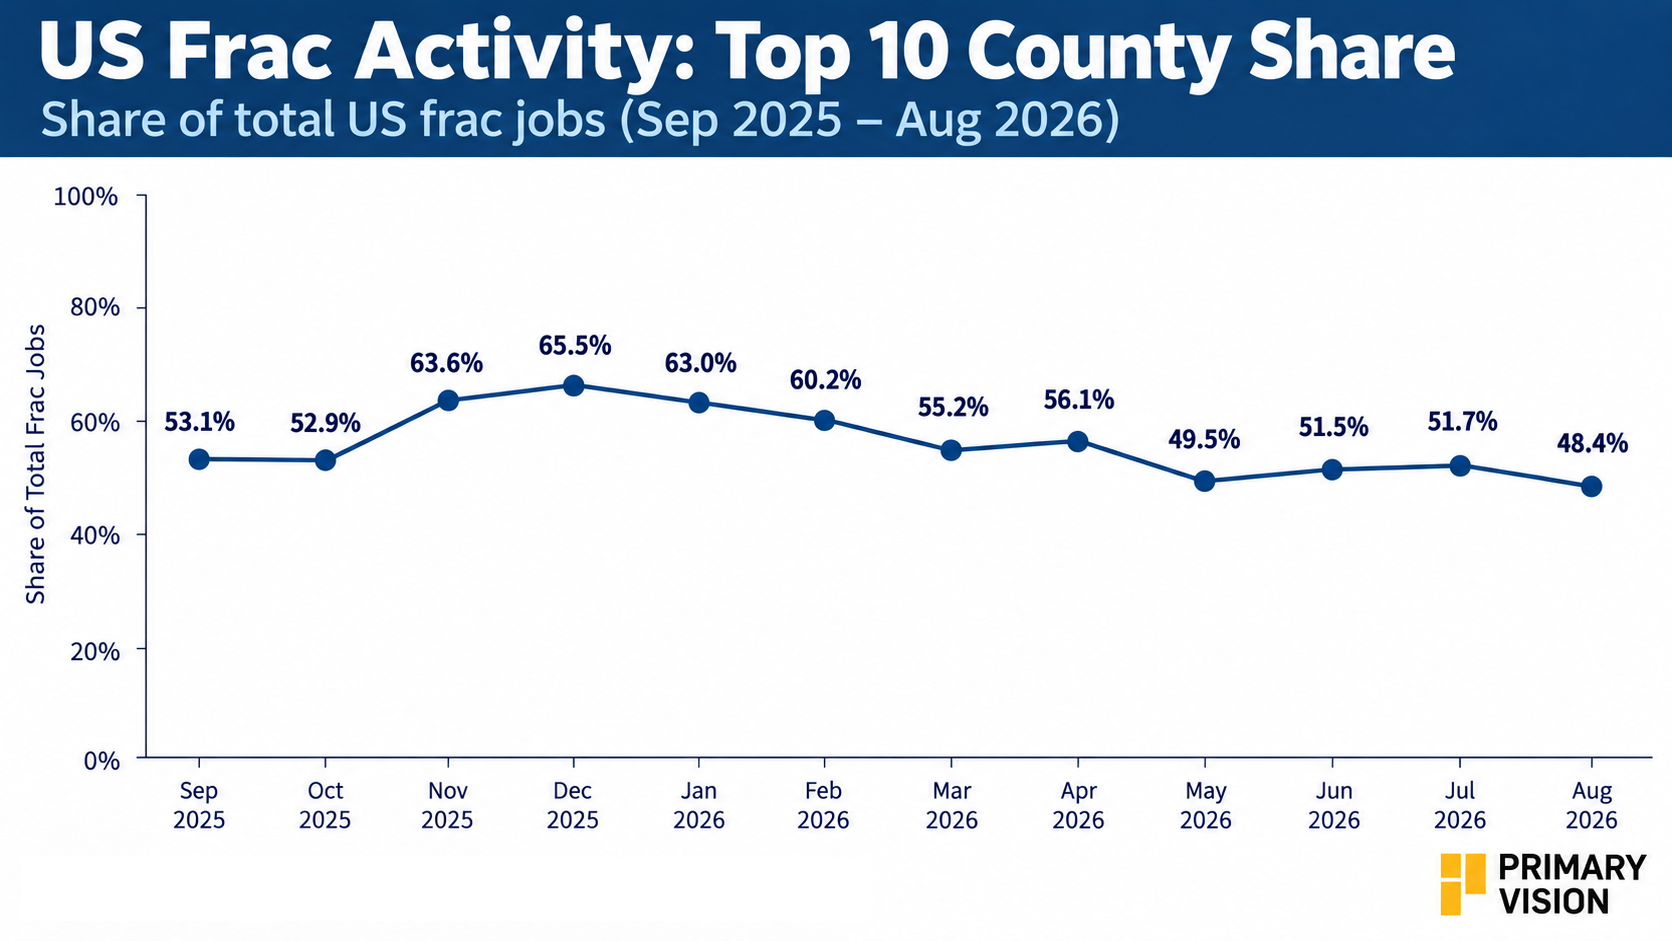
Primary Vision's county-level data shows that U.S. frac activity is not evenly distributed. In August 2026, the top 10 counties represented 48.4% of total frac jobs, 2% below May but 26% below the December 2025 peak. The decline does not mean activity simply disappeared; some work shifted from the most concentrated counties into a broader group of producing areas.
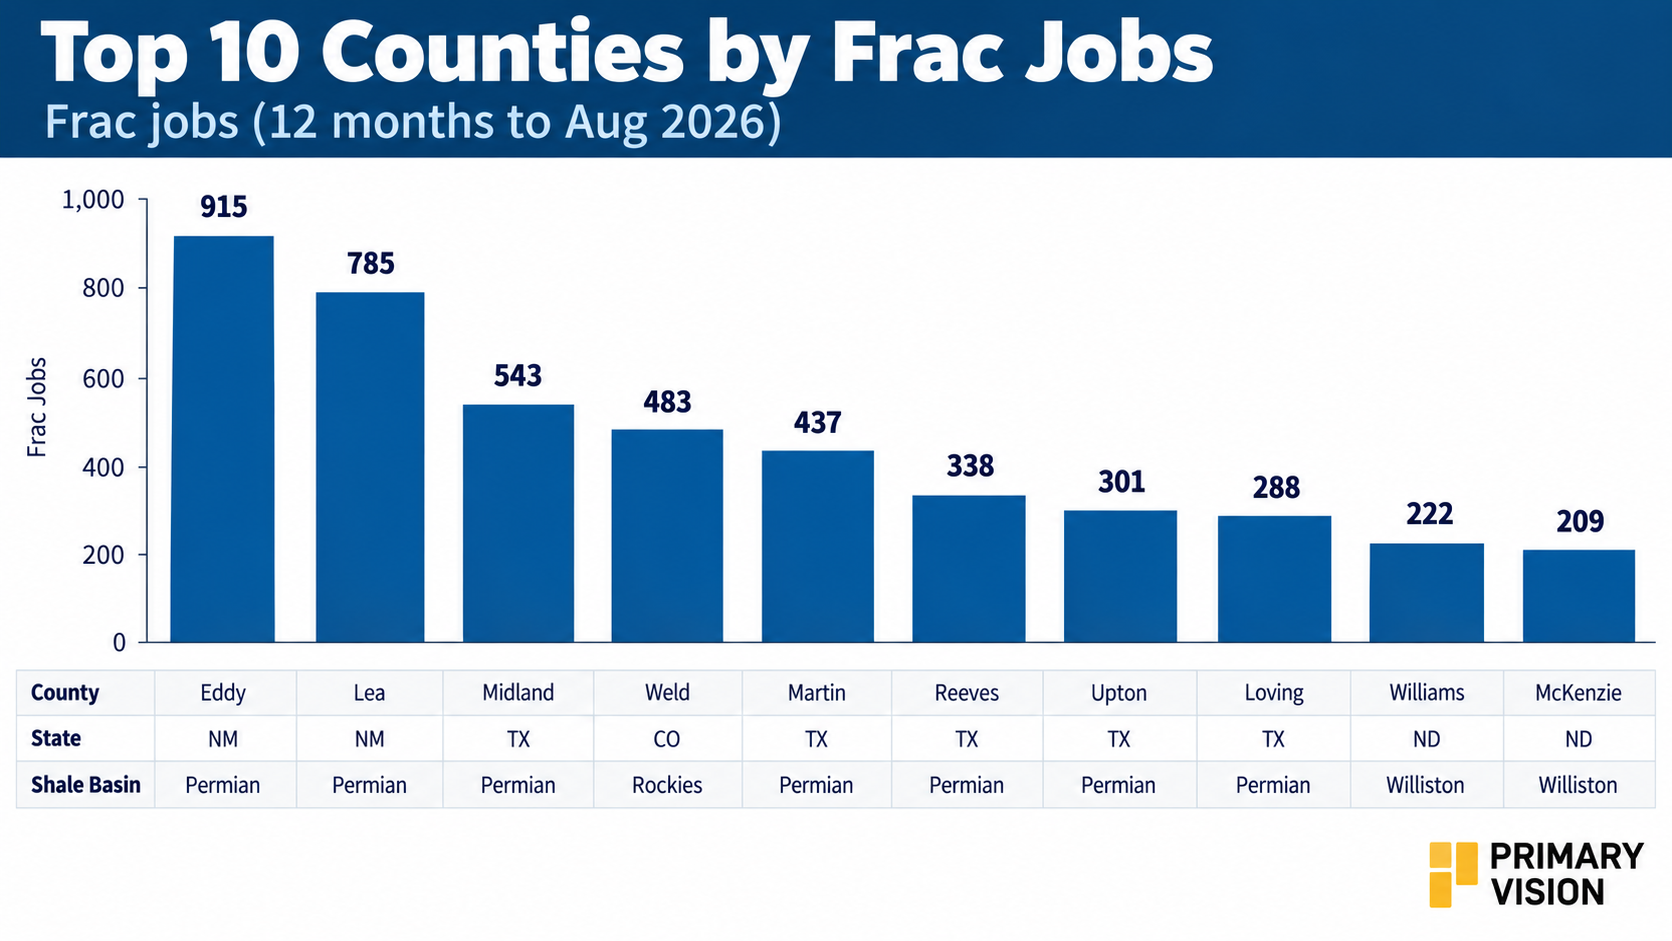
That shift is visible among the leaders. Eddy County in the Permian remains the largest market, followed by Lea County in the Permian, but the gap widens quickly. Midland County in the Permian was about 41% below Eddy, while Martin County in the Permian was roughly 52% lower.
This matters because county concentration provides a different view of the frac market than national job counts alone. As activity moves between counties, the demand for pressure pumping, sand and other completion services can shift even when national activity changes less dramatically.
The Permian Dominates The Ranking
The concentration is also geographic. Seven of the 10 leading counties are in the Permian, accounting for roughly 80% of activity within the top-10 group. Eddy and Lea anchor the Delaware, while Midland and Martin represent the Midland Basin. Reeves, Upton and Loving add further depth to the Permian footprint.
But the Permian is not one uniform frac market. Different operator positions, inventory quality and development schedules help explain why activity varies significantly between counties within the same basin.
Outside the Permian, Weld in the Rockies and McKenzie in the Williston remain meaningful centers of completion activity. The market is therefore concentrated, but not dependent on a single basin.
Why Are These Counties So Active?
The leading counties combine scale and continuity of development. Established drilling positions, infrastructure and service networks allow operators to maintain completion activity even as the broader U.S. market changes.
Yet the widening gap between the leaders shows that basin fundamentals alone do not determine activity. Operator development schedules and local inventory decisions matter too. Operators may accelerate activity in counties where they see the strongest near-term inventory. But they can also slowdown or shift work elsewhere within the same basin. This can create meaningful differences between neighboring counties even when the broader basin remains active.
Concentration Moves With The Cycle
The monthly data shows that the county core can expand and contract. The top-10 share increased 23% from September to December 2025 before declining 24% to the May 2026 low. It then declined another 2% through August.
For oilfield services, that movement matters. Pressure pumping, sand, water, and other completion services follow the wells being completed. Basin-level activity can therefore appear relatively stable while the geographic location of that activity changes materially.
What The Data Actually Shows
County-level frac data provides a more granular view than basin-level activity. It identifies the specific markets where completion work is occurring and tracks how concentrated that activity has become.
It does not, by itself, establish production, acreage quality, or future inventory. Completion intensity can also differ significantly between counties.
That sets up Part 2. We will move from where the frac jobs are to how much proppant is associated with those jobs, using only observations where the proppant data is sufficiently meaningful for comparison.
Upgrade to Pro Today and get…
• This article — plus dozens more each month, all within our full Research Module
• Frac Hits — our National-Level Frac Spread Count and Frac Job Count, updated weekly
• Frac Operator Monitor — detailed FSC & FJC by operator
• And so much more, designed to help you track, forecast, and outperform