

Articles
Jet Fuel Part II: Reading the Charts — What the Data Is Telling Us
By Osama on April 3, 2026 in Free Articles
By: Avik Chodhury and Osama Rizvi
In Part I, we laid out why jet fuel has become one of the most structurally interesting commodities in the refining complex. In this second piece, we dig into the charts: what the data on U.S. supply, exports, and crack spreads actually shows, and what it means for the margin outlook heading into 2026 and beyond. The picture that emerges is more nuanced than a simple bull or bear case — and, as recent events have reminded us, far more vulnerable to geopolitical shock than many investors had priced in.
Supply Stability vs Price Strength
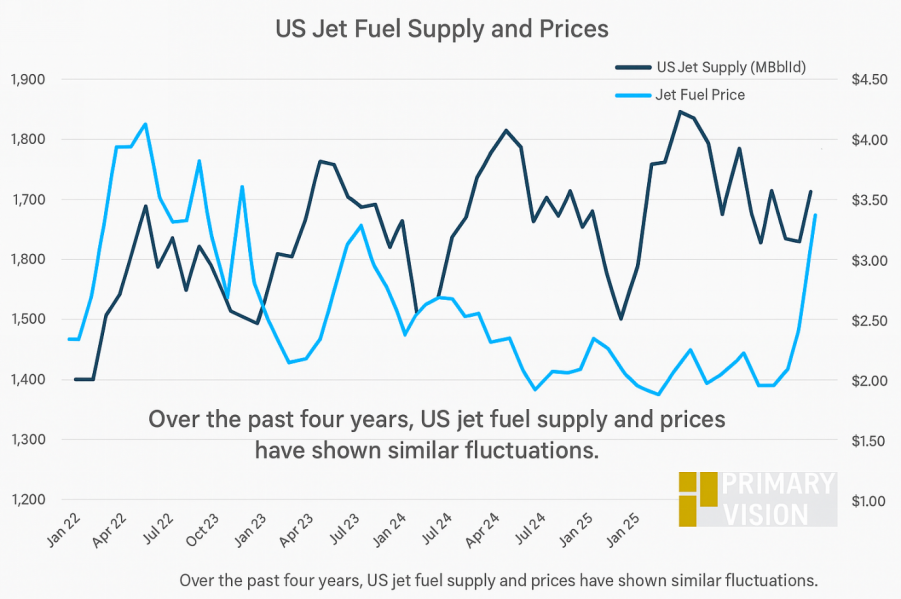
The first chart highlights that U.S. jet fuel prices have broadly moved in line with supply over the past few years, reinforcing the point that margins are being driven by the broader distillate balance rather than isolated aviation demand. However, the recent divergence—where prices move higher despite relatively stable supply—suggests tightening conditions, likely reflecting refinery constraints and rising crude-linked cost pressures.
Exports Driving Market Tightness
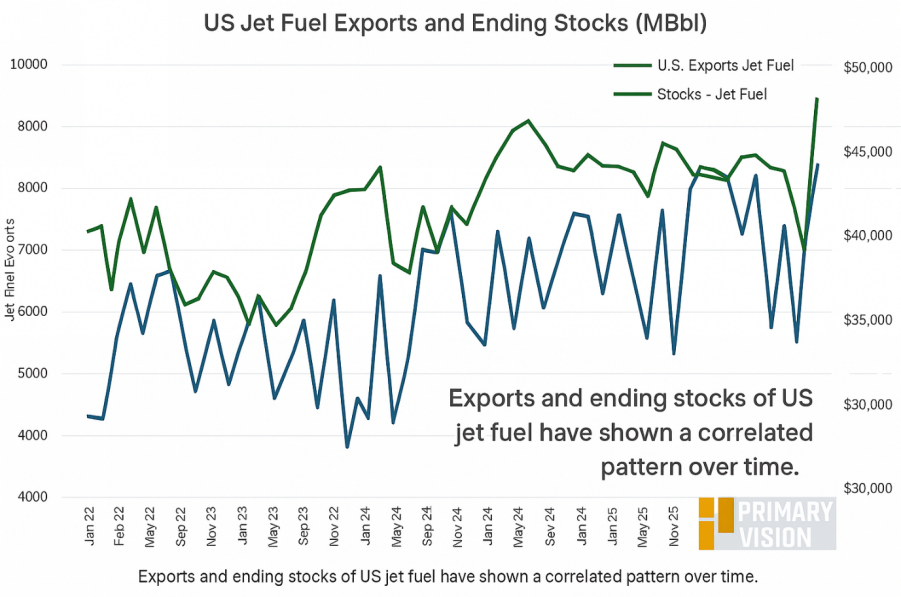
The second chart shows a clear relationship between exports and ending stocks, indicating that U.S. jet fuel is increasingly acting as a balancing barrel in global markets. Higher export flows appear to coincide with drawdowns or tighter stock levels, supporting the view that global demand—particularly from deficit regions—is playing a growing role in shaping domestic availability and pricing dynamics.
Jet Fuel Margins: Entering a More Balanced Phase
Jet fuel margins are shifting from a supply-constrained spike to a more balanced cycle. Management across ExxonMobil, Shell plc, and TotalEnergies continues to frame jet fuel within the broader middle distillate complex, where tight inventories and limited refining capacity drove outsized margins over the past two years. However, as new capacity comes online and utilization improves, I think the extreme tightness that supported peak cracks is beginning to ease. Aviation demand remains a steady tailwind, particularly in Asia and the Middle East, but it is no longer the sole driver of margin expansion.
Outlook: Structurally Supported, Cyclically Capped
Now that we are in 2026, the thesis of “structurally supported, cyclically capped” margins still broadly holds — but with an important amendment. The floor is indeed higher than pre-COVID levels, underpinned by disciplined capacity additions, persistent distillate tightness, and a demand base that IATA projects will reach 5.2 billion passengers globally in 2026. SAF remains a structural theme but not yet a near-term constraint. The ceiling, however, is no longer just about incremental refinery supply or diesel normalization — it is now also about how quickly the geopolitical premium fades, and whether it fades at all.
Crude Volatility Adds Near-Term Upside and Risk
This risk is no longer theoretical. Since late February 2026, the conflict in the Middle East has disrupted tanker transits through the Strait of Hormuz. With that supply corridor under stress, jet fuel crack spreads have surged across Asia, Northwest Europe, and the U.S. Gulf Coast, with jet/kero cracks emerging as the primary driver of overall refining margins. U.S. jet fuel prices reached approximately $6.86 per gallon in March 2026, prompting airlines including Delta and United to issue profit warnings and begin reducing capacity. The pattern described earlier — disruption, spike, normalization — may still hold, but the timeline and magnitude of normalization are now far less certain.
Takeaway
So, the setup is no longer about scarcity-driven upside, but about navigating a more normalized cycle where demand growth supports the floor, supply response caps the ceiling — and geopolitical shocks remind us that the floor itself can shift without warning.
Tags:


