






Articles
Understanding US Shale: Can Oil Price Alone Explain US Shale Growth?
By Osama on August 19, 2026 in Free Articles
Every time oil prices move, the headlines move with them. Prices dip and everyone assumes shale is about to slow down. Prices climb and suddenly production forecasts get revised upward. It is a clean story, and it is also an incomplete one. Price tells you what operators want to do. It does not tell you what is actually happening on the ground right now. For that, you need to watch the equipment. This is the first part of a series where we will look at the data points that actually move ahead of production, starting with the one Primary Vision has tracked since decades: the Frac Spread Count.
A frac spread, sometimes called a frac fleet, is the grouping of equipment an oilfield service company uses to hydraulically fracture a well. It is not one machine, it is a coordinated setup: fracturing pumps, data monitoring vans, water trucks, chemical storage trucks, frac blenders, and sand and frac fluid storage tanks, all working a pad at once. Our National Frac Spread Count adds up how many of these fleets are active across the US each week and publishes the number, which is why you will see it referenced by upstream, midstream and downstream players, financial firms, news outlets and service providers who have nothing to do with fracturing directly. A more granular version, broken down by spread location, job duration and operator/pumper correlation, goes out weekly to subscribers.
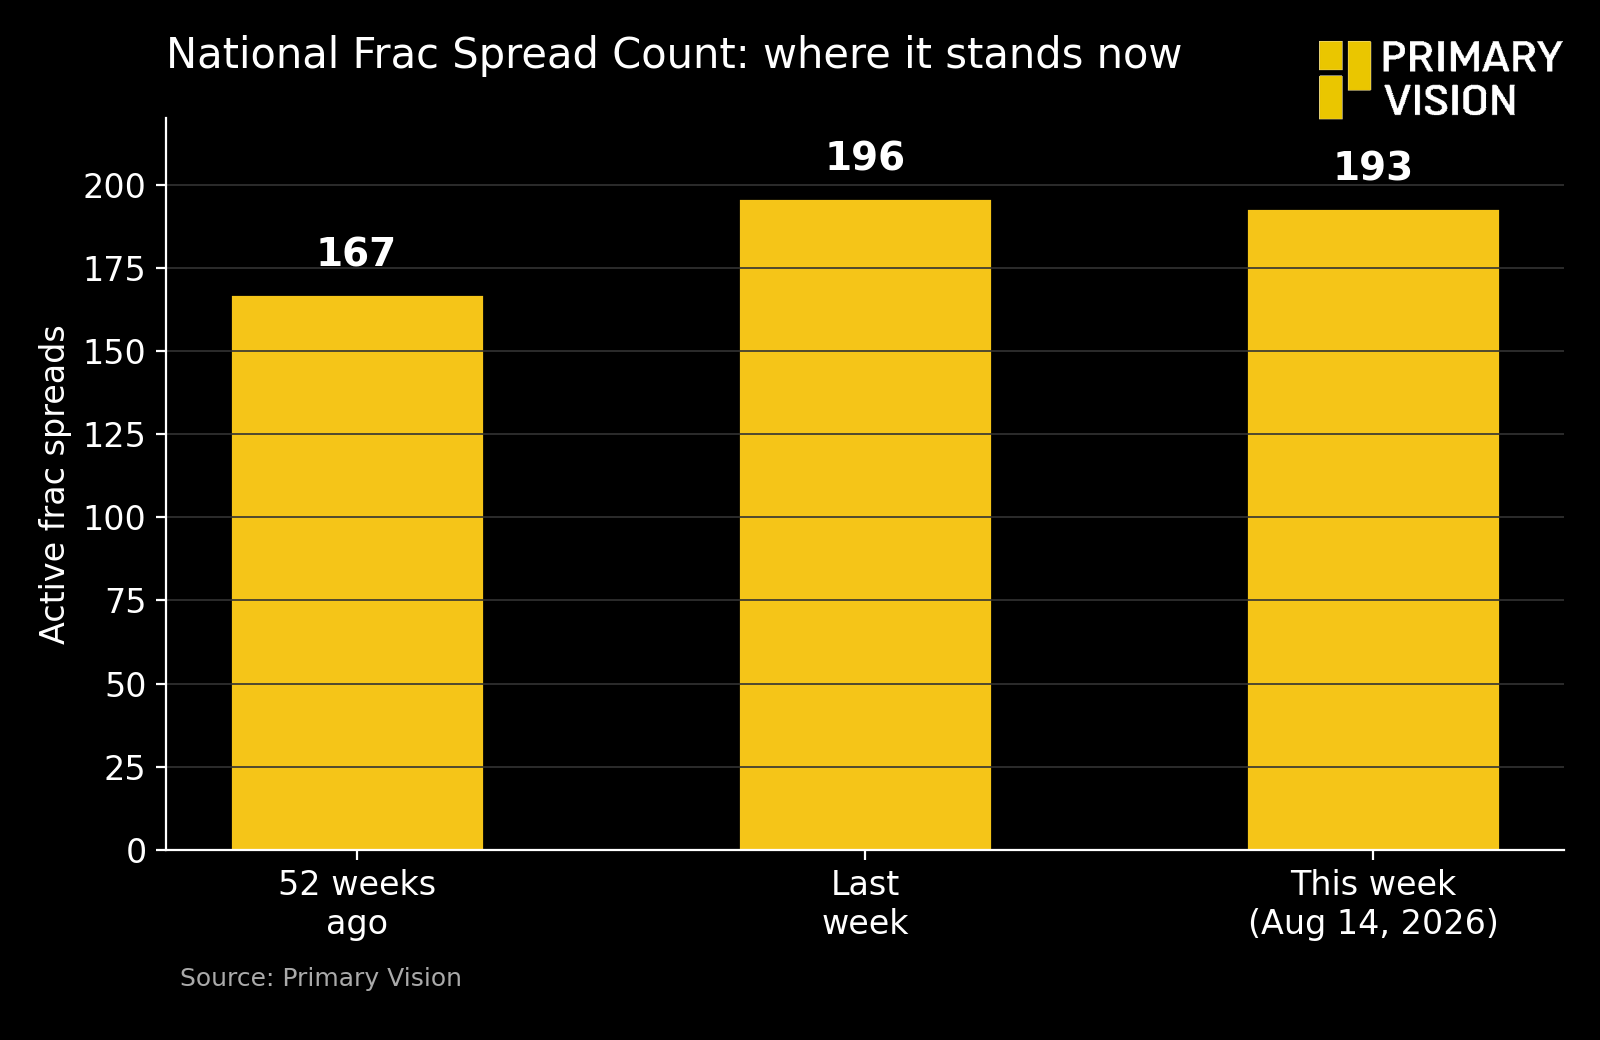
The number itself moves. As of August 14, 2026, the count sits at 193 active spreads nationally, down 3 from the week before but up 26 from a year ago. Why track completions specifically, rather than just drilling or price?. A well can sit drilled and uncompleted for months and produce nothing. It cannot sit fracked and uncompleted. Once a spread has worked a well, oil is coming, usually within weeks. That proximity to actual output is what makes FSC worth layering onto whatever else you're watching. Here are three moments where it told you something price alone would not have.
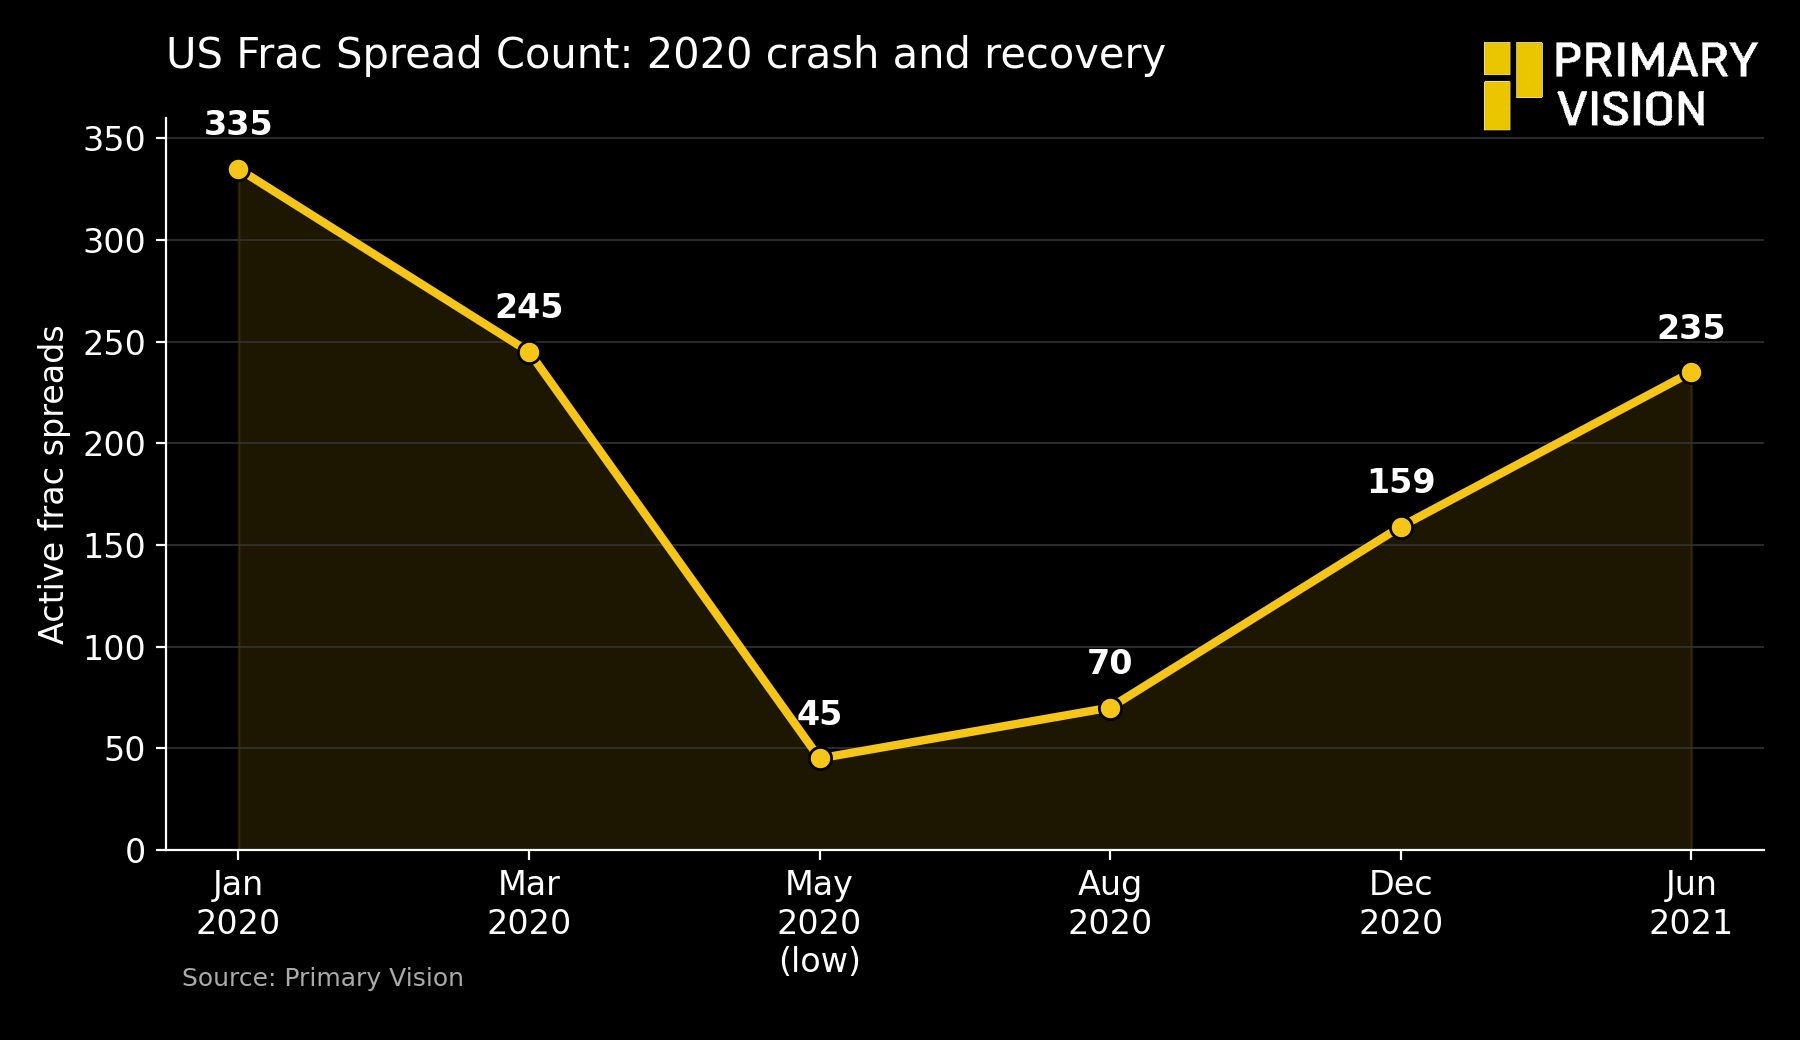
Start with the 2020 crash and the recovery that followed. Spreads opened 2020 above 330, then collapsed to 45 active fleets by mid-May as prices fell off a cliff and operators shut everything down. From there the climb back was slow and uneven, into the 70s by August, into the 150s by December, and by June 2021 the count had risen more than 400 percent off that low. That surge was not enough to push production into growth mode. What it did was keep output near 10.6 million barrels a day through a stretch when EIA itself was forecasting production would keep falling toward 10.9 million barrels a day in 2021. If you were only watching price, still stuck near $29 to $42 a barrel for most of that window, you would have missed the signal that the bleeding had actually stopped.
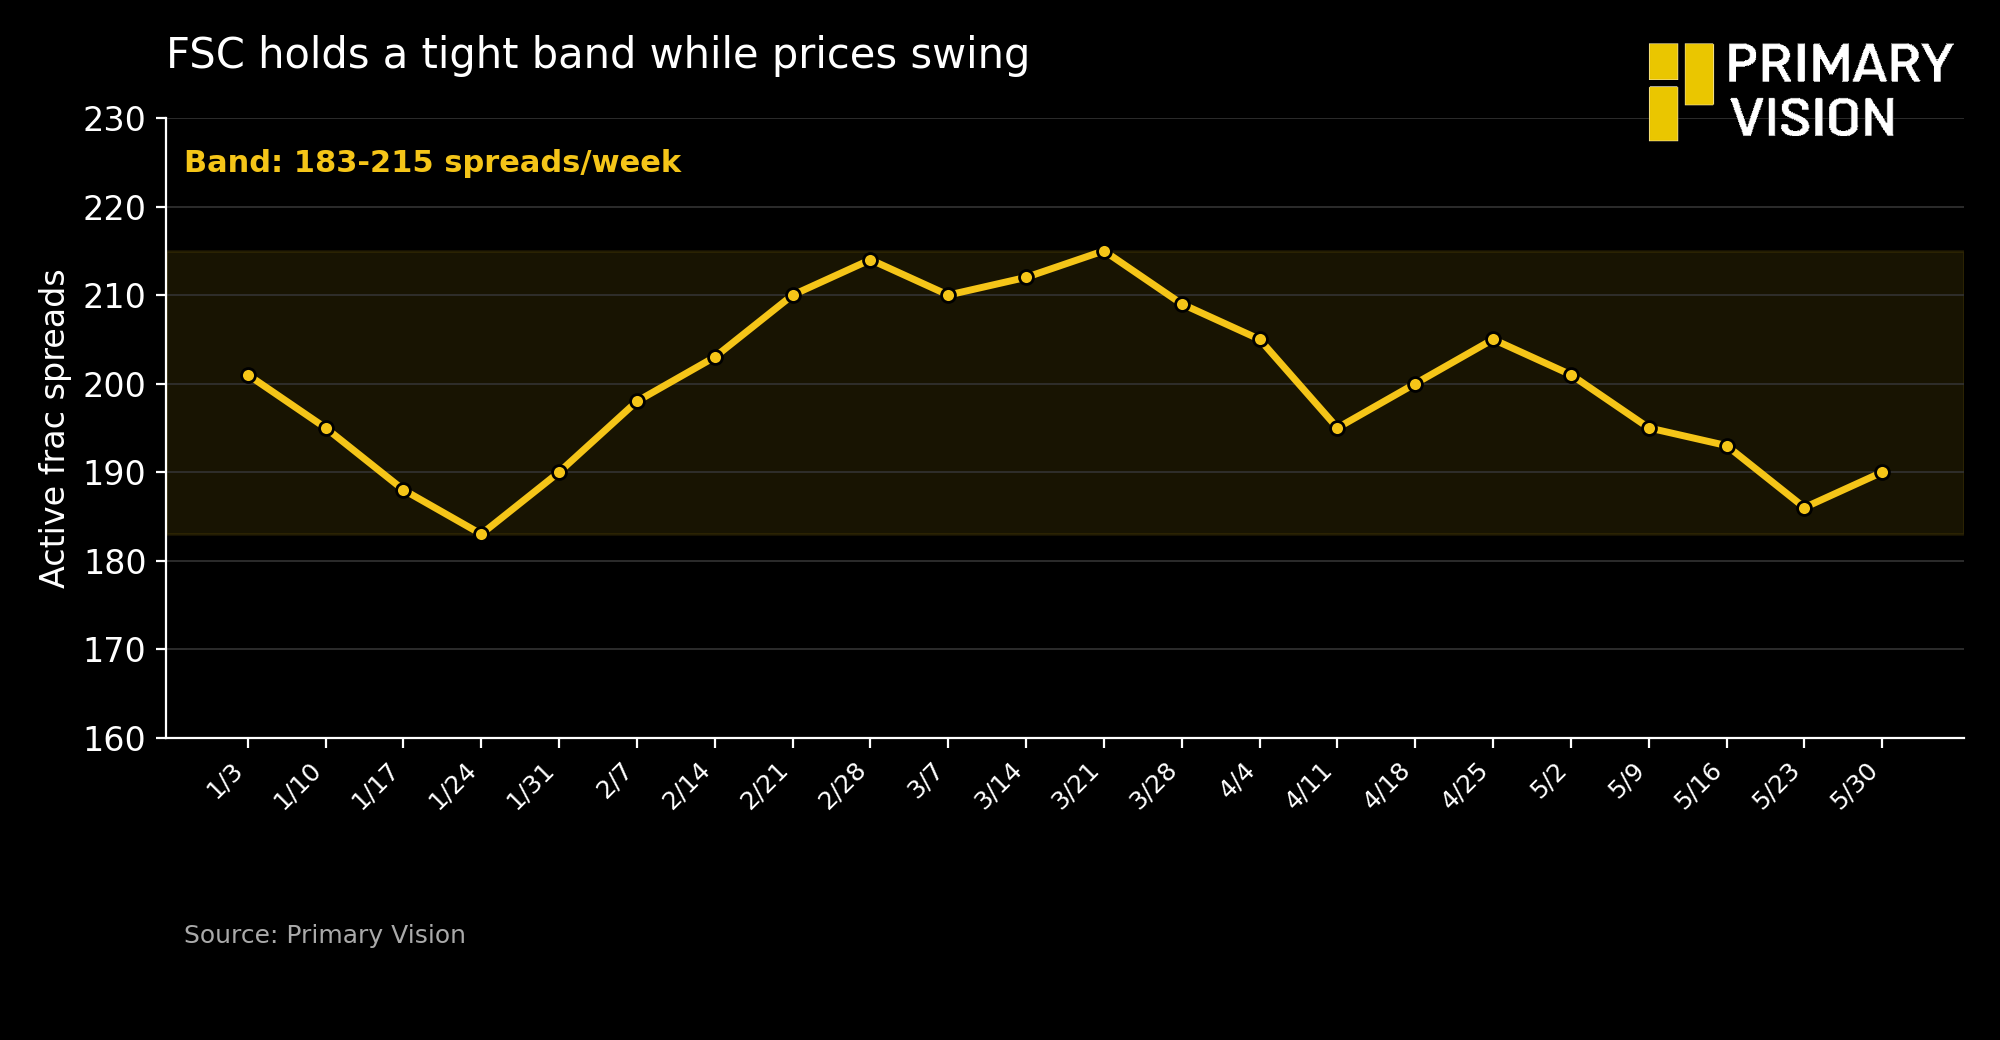
Then look at the first five months of 2025, a stretch when oil prices swung hard on tariff headlines and demand worries, dropping into the high $50s at one point after starting the year near $75. FSC did not swing with it. From January through May, the count held in a tight band, generally between 183 and 215 spreads a week, drifting up into February and March and easing back down by May without ever breaking out of that range. Production did not stall during any of that either. It kept climbing toward record territory. The spread count was telling you completions had settled into a steady rhythm well before the price chart made that obvious.
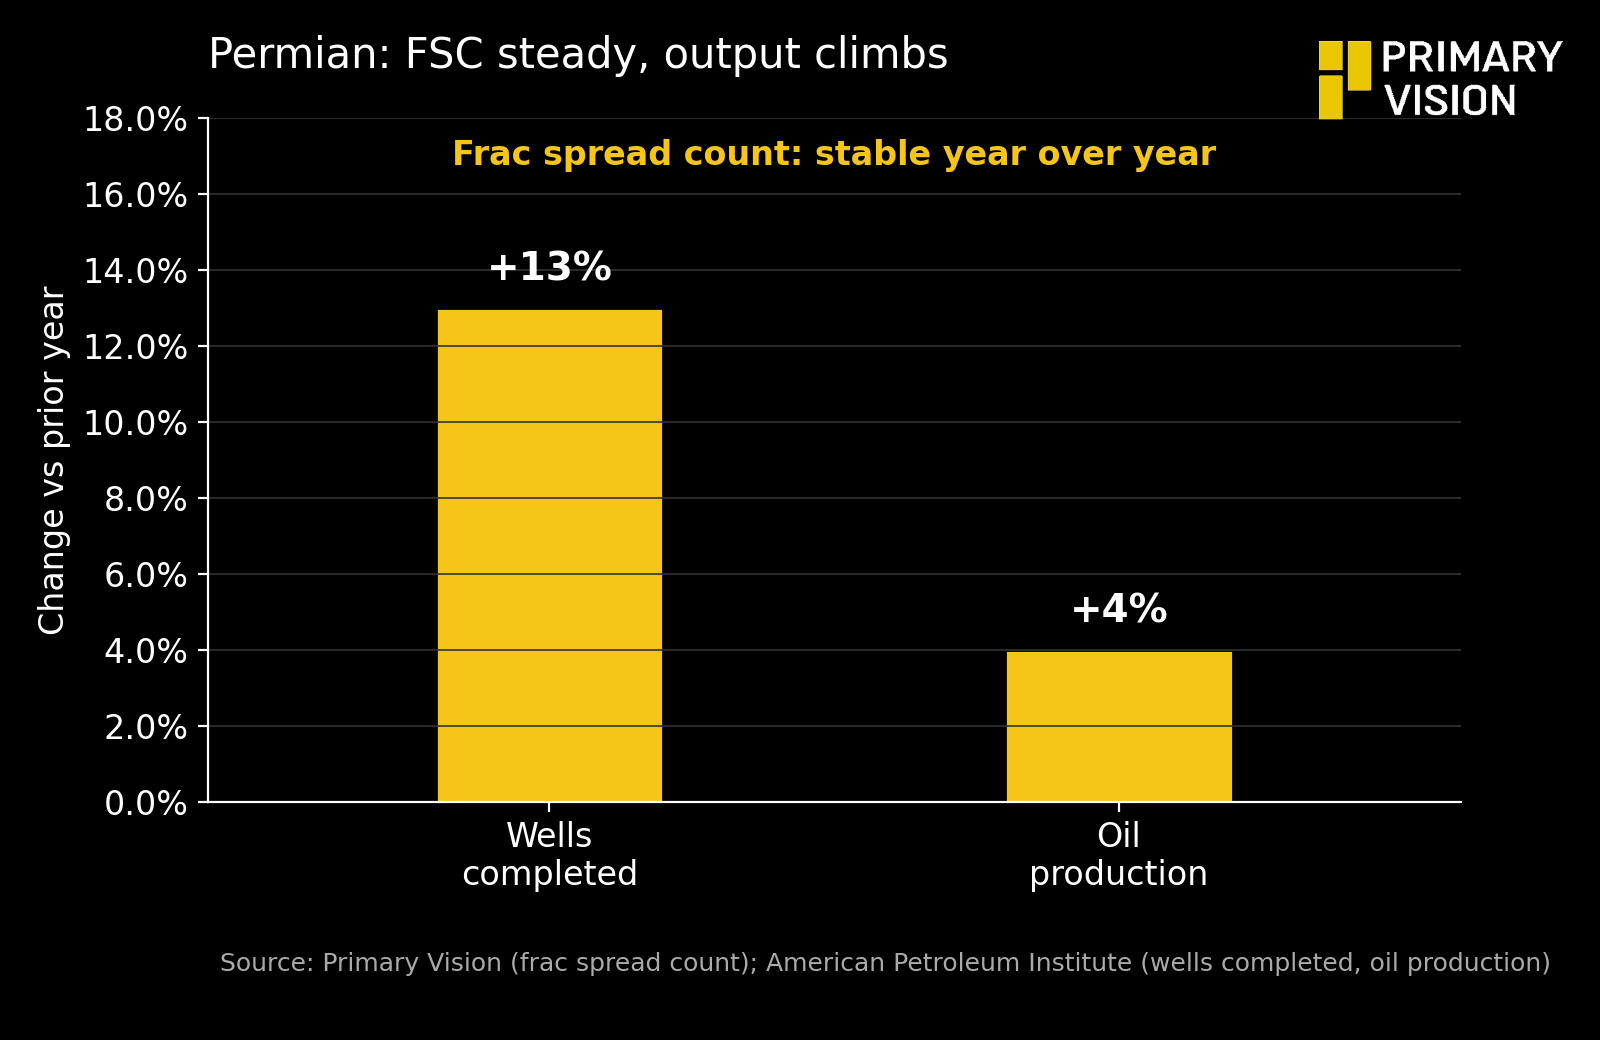
The third instance is the one worth sitting with, because it explains something the first two don't: how a steady spread count can still sit underneath rising production. In the Permian, the frac spread count has remained stable year over year. Yet operators completed roughly 6,800 wells, 13 percent more than the year before, and Permian oil production rose about 280,000 barrels a day. The crew count did not need to grow because each spread was doing more, largely through simul-frac, where a single fleet stimulates two wells at once instead of one, cutting the idle time built into older zipper-frac scheduling. When you see FSC hold steady while completions and output both climb, that combination is usually simul-frac and similar efficiency gains showing up in the data, not the count understating anything.
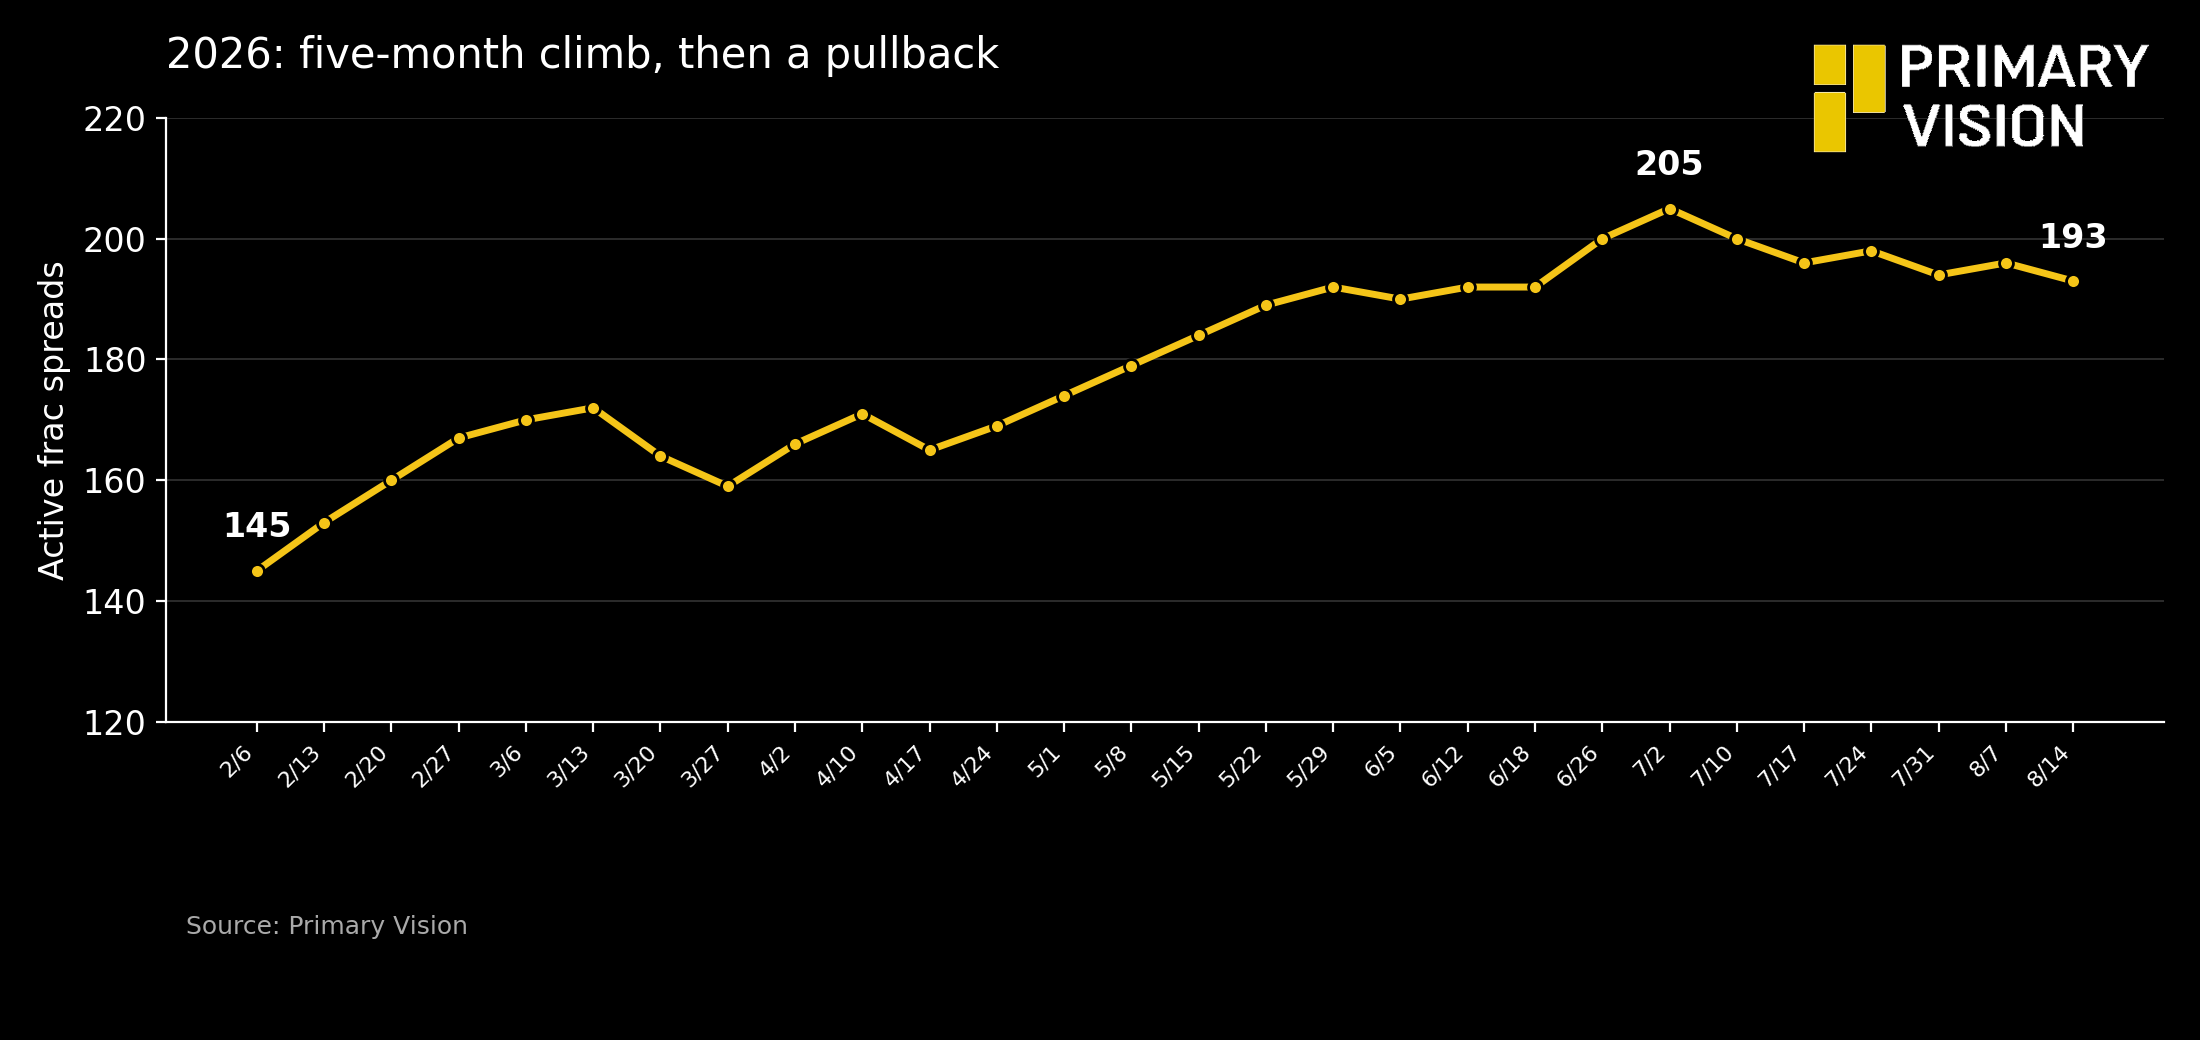
There is a fourth pattern worth watching right now, because it is still playing out. FSC bottomed at 145 in early February this year, then climbed for five months, with a few pullbacks along the way, up to 205 by early July. Since then it has actually eased back, down to 193 by mid-August, while rig count has kept rising over that same stretch, from the low 550s in February up into the low 590s now. That is close to the opposite of the 2020 to 2021 story, where spreads led and rigs lagged. Right now rigs are still being added while completions have leveled off. Whether that is a seasonal pause or the start of something else is exactly the kind of question this series exists to keep an eye on.
None of this means price is useless. It means price is one layer of a picture that has several, and completions activity, along with how much work each spread is getting out of a given week, is a layer most people never think to check. That is the case for building FSC into how you read the shale story, alongside everything else you're already watching.
In part two, we will look into various use cases for FSC and also explore the role of Frac Job Count in the US shale industry.
Tags: