






Articles
What Another $10 of Oil Could Mean for U.S. Producers
By Osama on October 21, 2026 in Free Articles
An oil-price rally can lift producer profits long before it brings additional barrels to market. That distinction has become increasingly important in 2026. Shareholders watching the geopolitical premium in crude are asking a straightforward question: if prices rise another $10 or $20 a barrel, how much additional money will producers make, and how much of it could reach investors? Quarterly production changes tell only part of the story. Company disclosures provide a more useful starting point: the sensitivity of earnings and cash generation to sustained changes in benchmark prices.
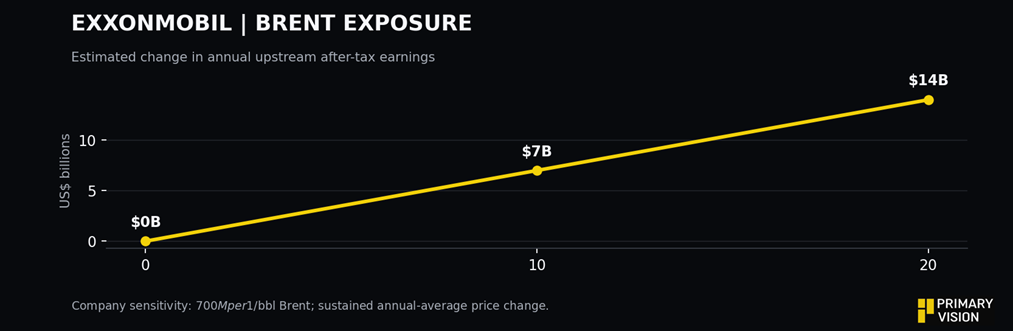
For ExxonMobil, the scale is considerable. In its 2025 annual filing the company estimates that every $1 increase in Brent adds about $700 million to annual after-tax upstream earnings, based on expected 2026 volumes. A sustained $10 rise therefore implies roughly $7 billion, and $20 around $14 billion, before changes in other businesses. That is companywide upstream exposure, not solely Permian shale. Higher crude prices can also hurt downstream feedstock economics unless refining margins compensate.
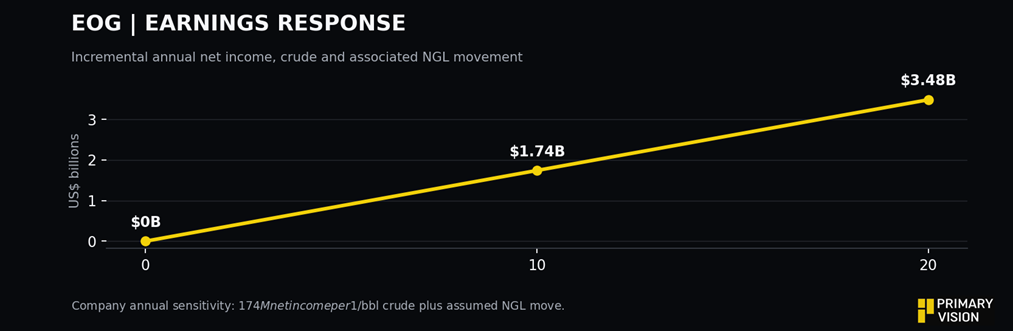
EOG Resources offers a closer view of an unconventional producer. Its 2026 Form 10-K estimates that a $1 change in crude and condensate prices, together with an assumed change in natural gas liquids prices, moves annual net income by about $174 million and pretax operating cash flow by $223 million. A $10 increase thus implies $1.74 billion of additional net income and $2.23 billion of pretax operating cash flow, assuming the disclosed relationships hold. These measures cannot be equated with free cash flow; taxes, working capital, investment and hedging all matter.
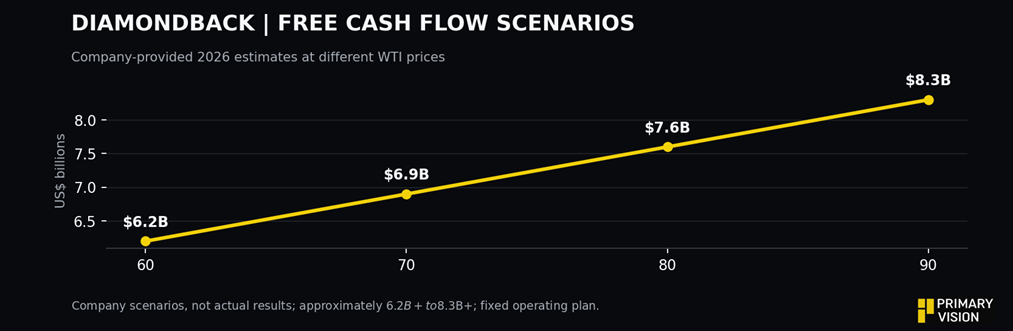
Diamondback provides an unusually tangible free-cash-flow comparison. Its 2026 operating-plan presentation shows projected annual free cash flow of more than $6.2 billion at $60 WTI, $6.9 billion at $70, $7.6 billion at $80 and $8.3 billion at $90, holding its operating assumptions broadly constant. Each $10 step adds approximately $700 million. The figures are company scenarios, not actual results, and their stated price range should not be extrapolated mechanically into a $110 oil market.
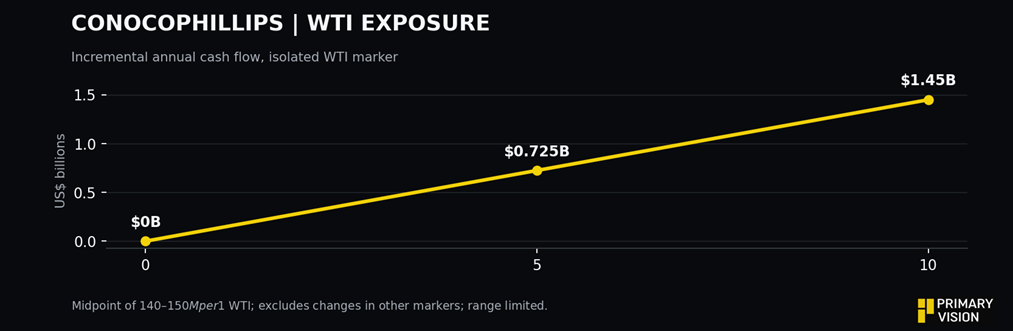
ConocoPhillips is another major beneficiary, although its exposure spans several oil benchmarks and natural gas markets. Its October 2026 sensitivity update estimates an annual cash-flow response of $140–150 million for each $1 move in WTI alone. A $10 shift suggests $1.4–1.5 billion of annual cash-flow sensitivity from that marker, before Brent, Alaska North Slope, Canadian crude, natural gas and other price changes. Crucially, the company notes that its published WTI sensitivity applies to a $50–80 range; using it above that range is illustrative, not a formal forecast.
The share-price implications are less mechanical. Higher expected cash flow can lift equity valuations, particularly when management returns the surplus through buybacks or dividends. A producer trading on a relatively high free-cash-flow yield may attract renewed interest if investors conclude that prices will remain elevated. Exxon’s diversified earnings base could cushion reversals; EOG, Diamondback and ConocoPhillips offer more concentrated exposure to upstream commodity cash generation. But shares may already reflect much of the upside, and higher geopolitical risk can raise the discount rate investors apply to future earnings.
There is also a difference between a $10 price spike lasting a few weeks and an extra $10 sustained over a year. The sensitivities above assume annualized changes. Actual realized prices, production outages, hedges, taxes, service costs and management spending decisions will determine how much of the headline gain survives. An oil rally caused by lost supply may even reduce volumes at companies operating in affected regions.
For Primary Vision, the next piece of evidence will come from the field. Higher cash generation makes additional drilling and completions easier to finance, but it does not guarantee operators will accelerate activity. Tracking the Frac Spread Count alongside capital budgets, production guidance and shareholder distributions should help reveal whether the windfall is moving into new supply—or remaining on corporate balance sheets.
Tags: