

Articles
- BLOG / Articles / View
- Articles
Market Sentiment Tracker: Assessing Long Term Impacts of Hormuz Crisis
By Osama on June 2, 2026 in Market Sentiment
The current oil supply crisis should be understood as a macroeconomic shock, not only an energy-market event. The comparison with 1973 is useful because that episode showed how a physical disruption in oil supply can move into inflation, wages, interest rates, external balances, and political decision-making. In 1973, embargoed economies faced a loss of about 4.5 million barrels a day, roughly 7 percent of global supply. Today, the risk is tied to a route far more important to the modern trading system: the Strait of Hormuz, where flows averaged 20.9 million barrels a day in the first half of 2025, about 20 percent of global petroleum liquids consumption.
That difference matters. The 1970s shock hit economies that were more oil-intensive, but the present shock hits a world with longer supply chains, larger emerging-market import needs, and more fragile public finances. Bradford DeLong’s discussion of the 1970s in Slouching Towards Utopia treats the period as a break in the postwar growth order, when inflation, productivity disappointment, and policy uncertainty arrived together. The same risk exists now, although in a different form. Oil is no longer the only center of the global economy, but it remains one of the few inputs that can raise costs almost everywhere at once.
For the United States, the immediate risk is not physical shortage. It is inflation persistence. The U.S. is a much larger oil producer than it was in the 1970s, but domestic production does not fully insulate households or firms from global crude pricing. That matters because the U.S. data already show an economy that is neither weak enough to make policy easy nor strong enough to absorb another cost shock cleanly. Core PCE is still running at 3.3 percent year over year, headline PCE is at 3.8 percent, and real consumer spending has slowed to 0.1 percent month over month. At the same time, GDP growth at 1.6 percent is below consensus, while new home sales fell to 622,000 against expectations of 661,000. These numbers point to a familiar oil-shock problem: price pressure can stay firm even as the real economy loses momentum. That is why recent Fed commentary has been cautious; Kansas City Fed President Jeffrey Schmid warned against assuming the oil shock is simply transitory. The longer energy prices remain high, the harder it becomes for the Federal Reserve to cut rates without risking a renewed inflation impulse.

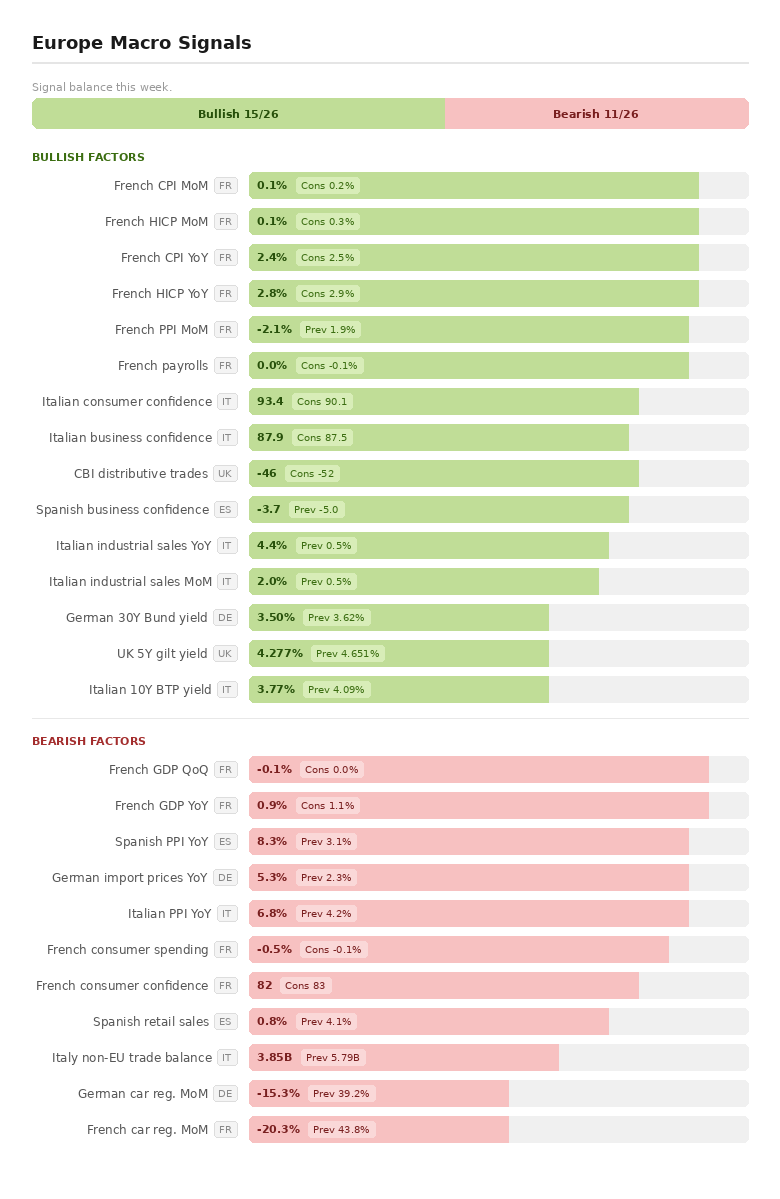
Europe faces a more direct industrial problem. The region has already spent several years adjusting to the loss of cheap Russian energy, and a renewed oil shock would arrive before that adjustment is complete. The country-level data show the tension clearly. France’s GDP contracted by 0.1 percent quarter over quarter, consumer spending fell 0.5 percent, and French HICP inflation still printed at 2.8 percent year over year. Germany’s import price index rose 5.3 percent year over year, which is important because import prices are one of the channels through which energy costs enter producer margins. Italy looks somewhat more resilient in sentiment terms, with consumer confidence at 93.4 and business confidence at 87.9, but its producer-price data still show cost pressure. This is why Europe’s exposure is not only about petrol prices. It is about whether manufacturers, transport firms, airlines, and chemical producers can protect margins without passing too much cost into final prices. The broader implication is that Europe may move faster toward energy security as industrial policy.
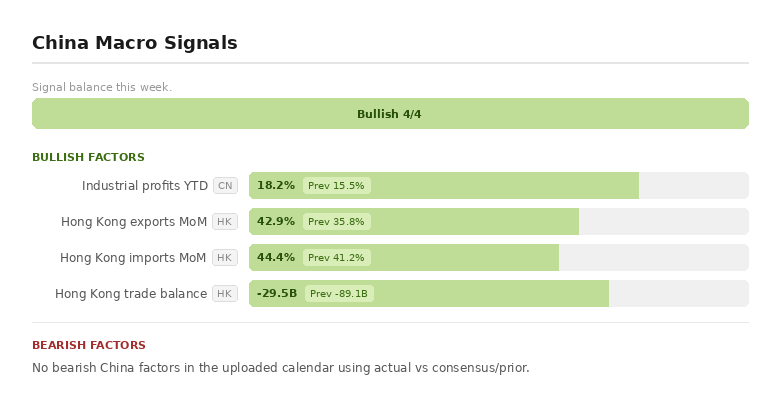
China’s exposure is different because it is more closely tied to imported supply routes and manufacturing margins. Asia receives a large share of the crude moving through Hormuz, and China’s economy still relies heavily on imported energy to support refining, transport, petrochemicals, and export production. The domestic data do not show a collapse; industrial profits rose 18.2 percent year to date. But that figure should not be read as immunity. It may instead reflect a system that is still being supported by industrial policy, external demand, and cost management rather than broad private-sector strength. A major oil shock would raise input costs at the same time that China is trying to stabilize property, protect employment, and manage weak confidence. Higher crude prices would also hurt many of China’s trading partners, which matters because external demand has been one of the few reliable supports for Chinese industry. Recent reporting already shows that Asia’s additional U.S. crude imports cannot fully offset Hormuz losses.
Pakistan sits closer to the hardest edge of this crisis. It is an oil-importing economy with limited fiscal space, recurring balance-of-payments pressure, and a currency that can come under stress when the import bill rises. The 1973 shock shifted financial power toward oil exporters and created external-pressure problems across importing economies. The U.S. State Department’s account of the 1973–74 oil embargo makes this point clearly: the shock did not only raise prices; it changed the global financial balance of power toward oil-producing states. For Pakistan, a disruption linked to 20 percent of global petroleum consumption would work through similar channels, but with less room for policy error. Higher oil prices would widen the trade deficit, raise transport and electricity costs, and feed inflation quickly into household budgets. The government would then face a difficult choice between passing prices through, increasing subsidies, tightening policy, or accepting further pressure on the rupee.
The larger lesson from 1973 is that oil shocks leave institutional effects. They change what governments consider normal. The shock may begin in oil markets, but its lasting impact would be seen in investment patterns, fiscal choices, and the return of energy security to the center of economic policy.
Tags:
Permission denied
Upgrade to Pro Today and get…
• This article — plus dozens more each month, all within our full Research Module
• Frac Hits — our National-Level Frac Spread Count and Frac Job Count, updated weekly
• Frac Operator Monitor — detailed FSC & FJC by operator
• And so much more, designed to help you track, forecast, and outperform


