Market Sentiment Tracker: Bond Markets Are Shrugging Off a War They Should Be Pricing In
By
Osama
on July 14, 2026
in
Market Sentiment
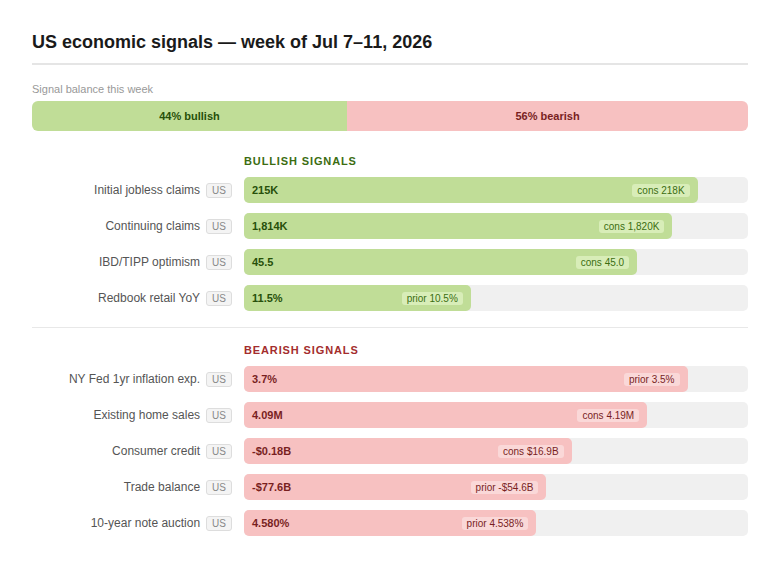
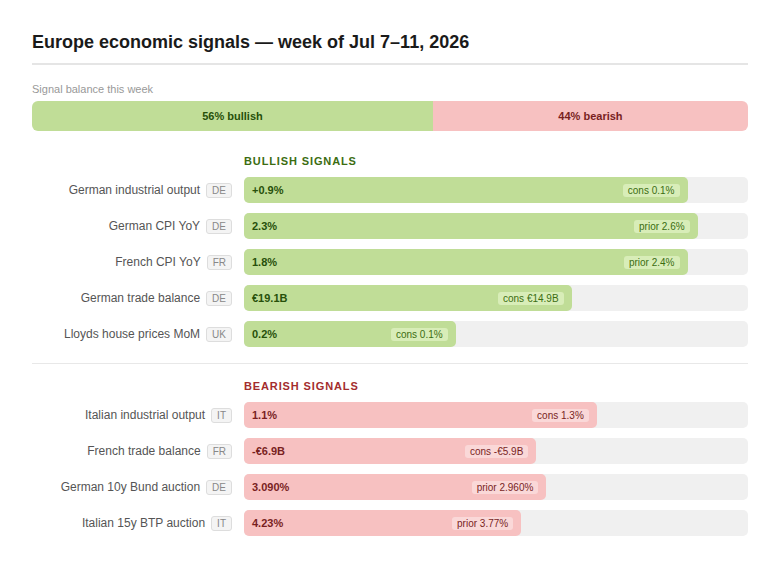
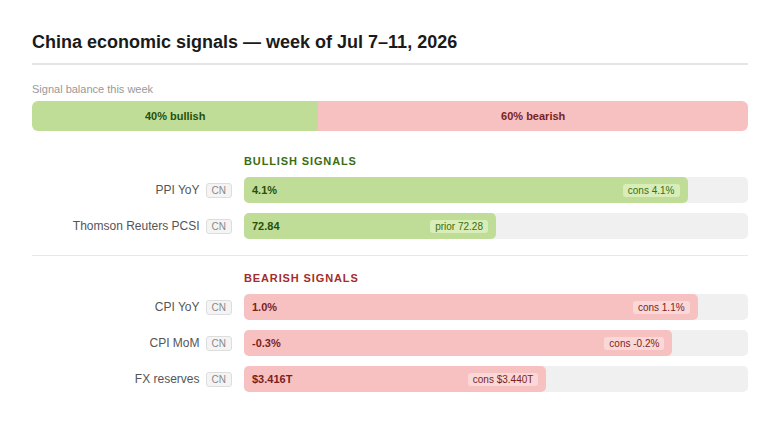
This week, while going through the data behind those charts, three trends stood out that I think deserve more attention than the headline prints usually get. They're not isolated — they connect, and together they say something about how this Iran conflict is actually being priced right now, not just what the numbers say on their own. Here's the rundown.
Bonds are selling off into a war
That shouldn't happen. An active Iran conflict is a risk-off backdrop, and risk-off backdrops typically send money into government debt, pushing yields down. Instead, the long end backed up almost everywhere at once. The 10-year note auction tailed to 4.580% from 4.538%. The 30-year printed 5.058%. German Bunds jumped to 3.090% from 2.960%, a meaningful move for that market. Italian 15-year BTPs went from 3.77% to 4.23%, a 46 basis point single-auction swing. Three sovereign curves, three currencies, one direction, one week. Term premium and inflation risk are currently outweighing the safe-haven bid across every major market at once — duration is being priced on fundamentals right now, not fear, and that's the part worth tracking closely.
Positioning shows a war hedge that skips oil
To see how the war is actually being priced, the more useful place to look is the CFTC positioning data. Gold longs built to 194.0K contracts from 181.3K, a standard war-risk hedge. Yen shorts got covered sharply, from -155.1K to -123.8K, consistent with a broader carry unwind. But crude longs actually fell, from 114.6K to 110.5K, and crude oil inventories posted a surprise build of 2.998M against a forecast draw of 1.9M. The interpretation is straightforward: the market is buying general instability insurance through metals and currencies, but it is not yet positioning for a physical disruption to crude supply. That's a meaningful gap. It suggests investors currently see this as a geopolitical risk event rather than an energy supply event. Albeit it is literally happening in the center of global energy supply chains!
Reserve flows point to the franc as the real haven
The clearest read on where real stress is building sits in Swiss reserve data, which jumped to $758.8B from $710.9B — an increase on a scale that typically only shows up when the Swiss National Bank is managing appreciation pressure from safe-haven inflows. At the same time, China's reserves slipped to $3.416T against a $3.440T consensus, Japan's fell to $1,287.5B from $1,305.9B, and South Africa's dropped to $74.11B from $76.58B. Capital is leaving the periphery and landing in the traditional haven, which is a more reliable stress indicator than any single price print this week.
Taken together, these three point to a specific and somewhat fragile setup. Bond markets are currently treating this conflict as background noise and pricing off fiscal and inflation fundamentals instead. Positioning data shows investors hedging the tail risk cheaply through gold and yen rather than committing capital to an oil supply disruption thesis. Reserve flows confirm that some capital is already moving defensively, even though that caution hasn't shown up in yields yet.
The variable that would break this setup is oil. If the conflict stays contained and no physical supply is affected, this configuration likely persists — yields continue to drift on term premium and inflation grounds, gold remains bid as cheap insurance, and crude positioning stays light because there is no supply story to price. But if the conflict escalates toward actual infrastructure or shipping routes, crude is the asset most likely to reprice quickly, and a sharp move there would probably pull yields back down on a growth-scare basis, unwinding a meaningful part of this week's rate moves. The Swiss reserve figure is the one worth watching most closely in the interim — a continued climb there would indicate that capital is pricing rising risk faster than the oil market is willing to acknowledge.
Upgrade to Pro Today and get…
• This article — plus dozens more each month, all within our full Research Module
• Frac Hits — our National-Level Frac Spread Count and Frac Job Count, updated weekly
• Frac Operator Monitor — detailed FSC & FJC by operator
• And so much more, designed to help you track, forecast, and outperform