

Articles
- BLOG / Articles / View
- Articles
Monday Macro View: What America's Top Drillers Are Actually Doing
By Osama on April 20, 2026 in Market Sentiment
Global oil markets are in the middle of a genuine supply shock — Strait of Hormuz restrictions have cut global deliveries by over 10 mb/d, with physical crude trading near $130, $140/bbl. Higher prices were pulling U.S. shale activity up, and the data was responding — but this week that momentum stalled. The national frac spread count sits at 165, down 6 on the week and 35 year-on-year. Frac job count is 212, rig count 543, both slipping. One week does not make a trend, but it is worth watching which operators are holding the line and which are pulling back. We focused on EOG Resources, Diamondback Energy, and ExxonMobil — selected for frac activity scale, structural diversity, and forecast signal quality — using Primary Vision's EFRACS Frac Operator Monitor.
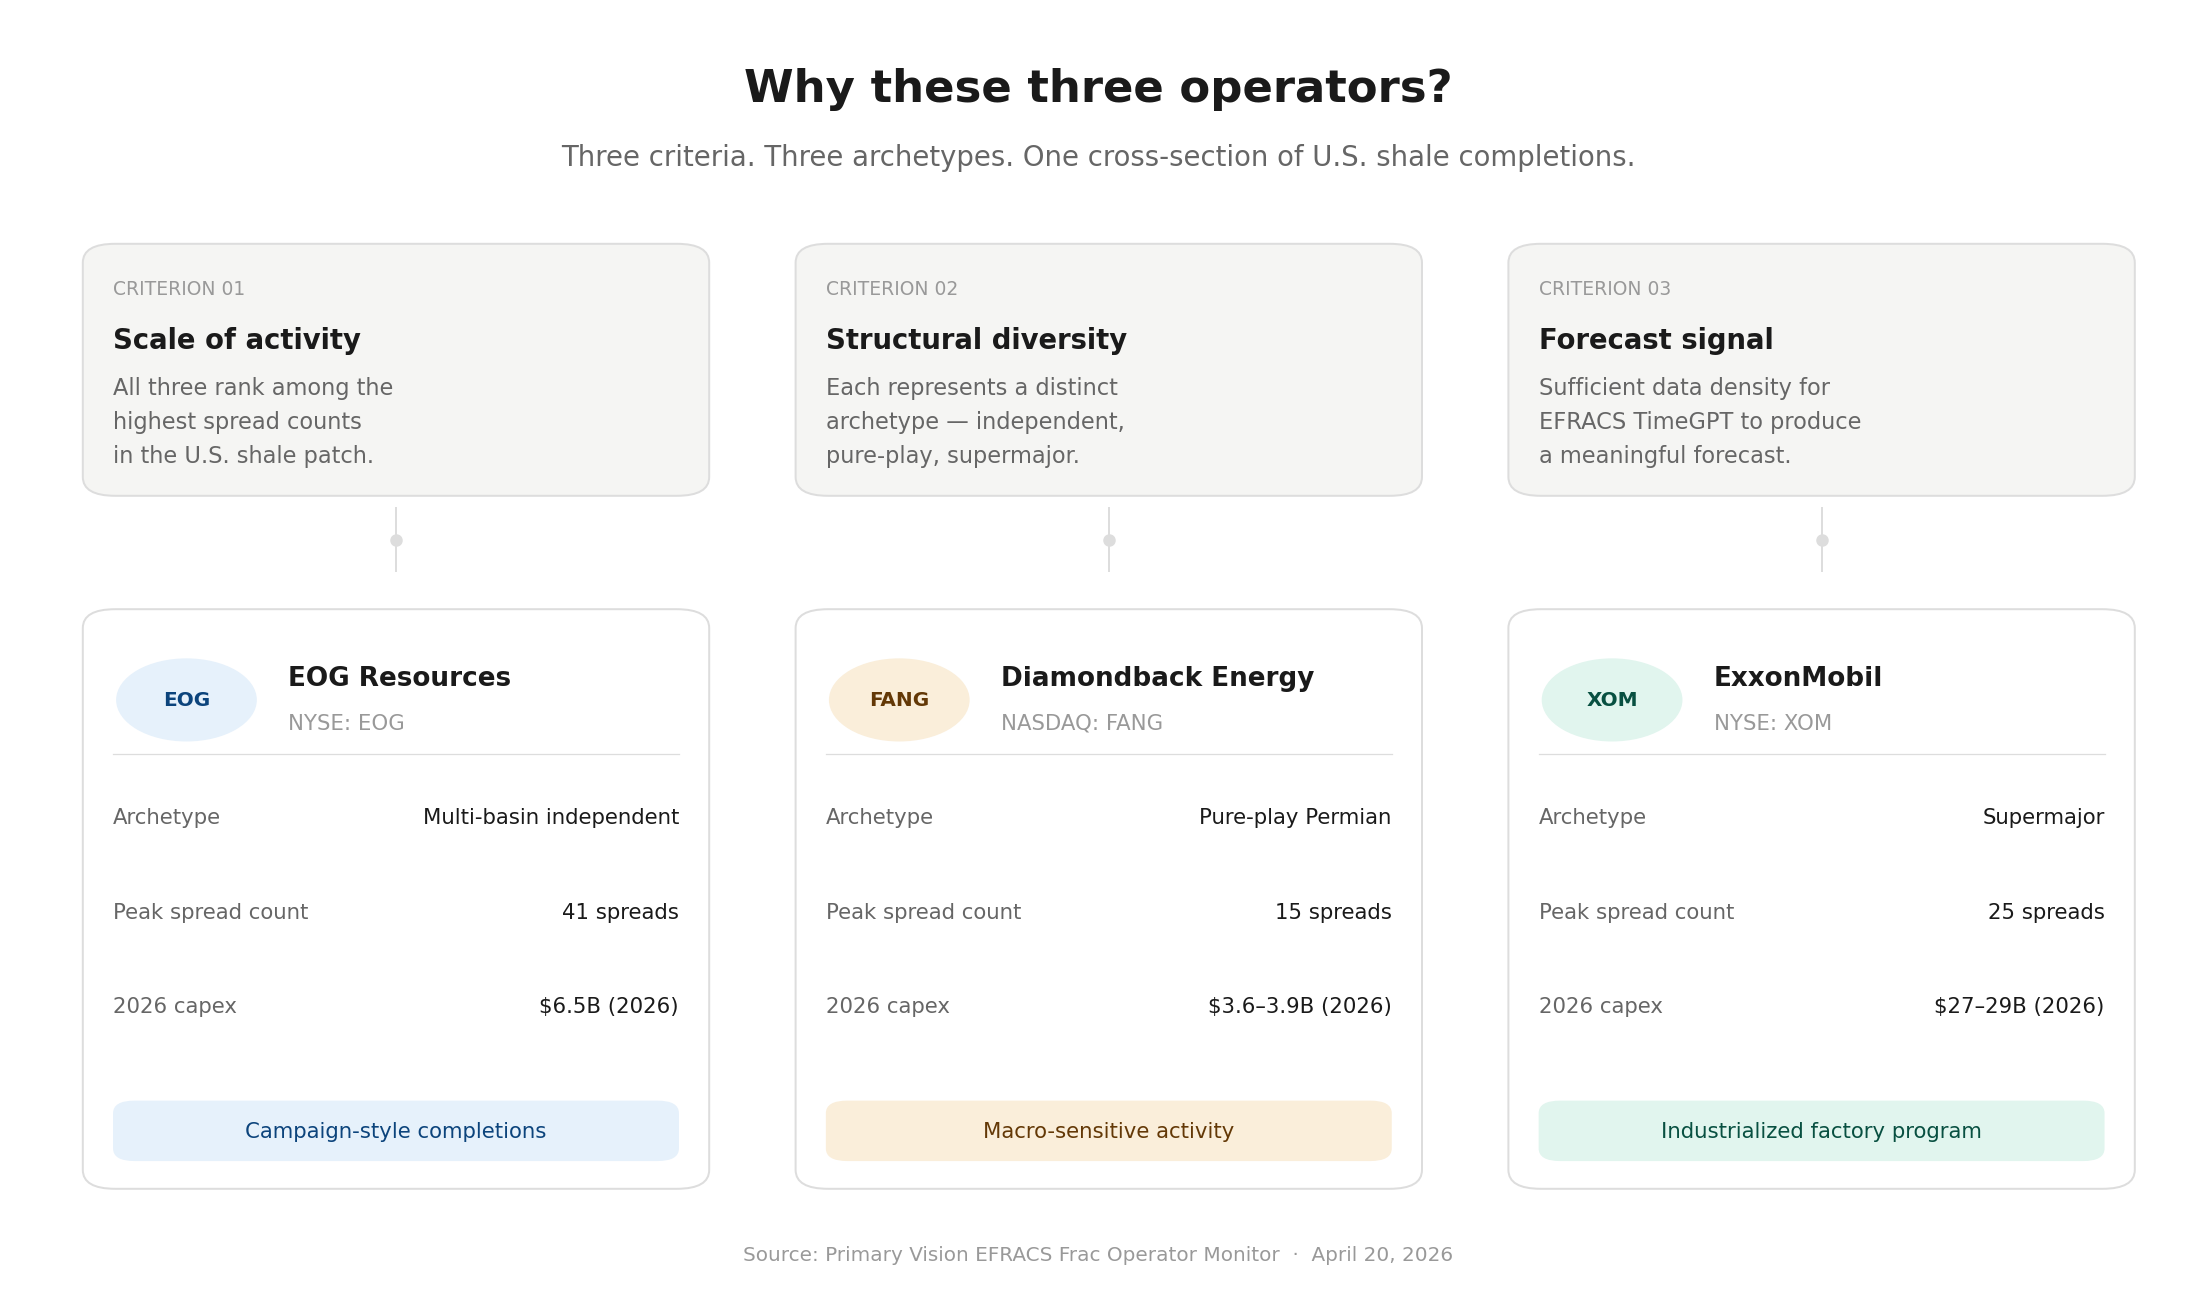
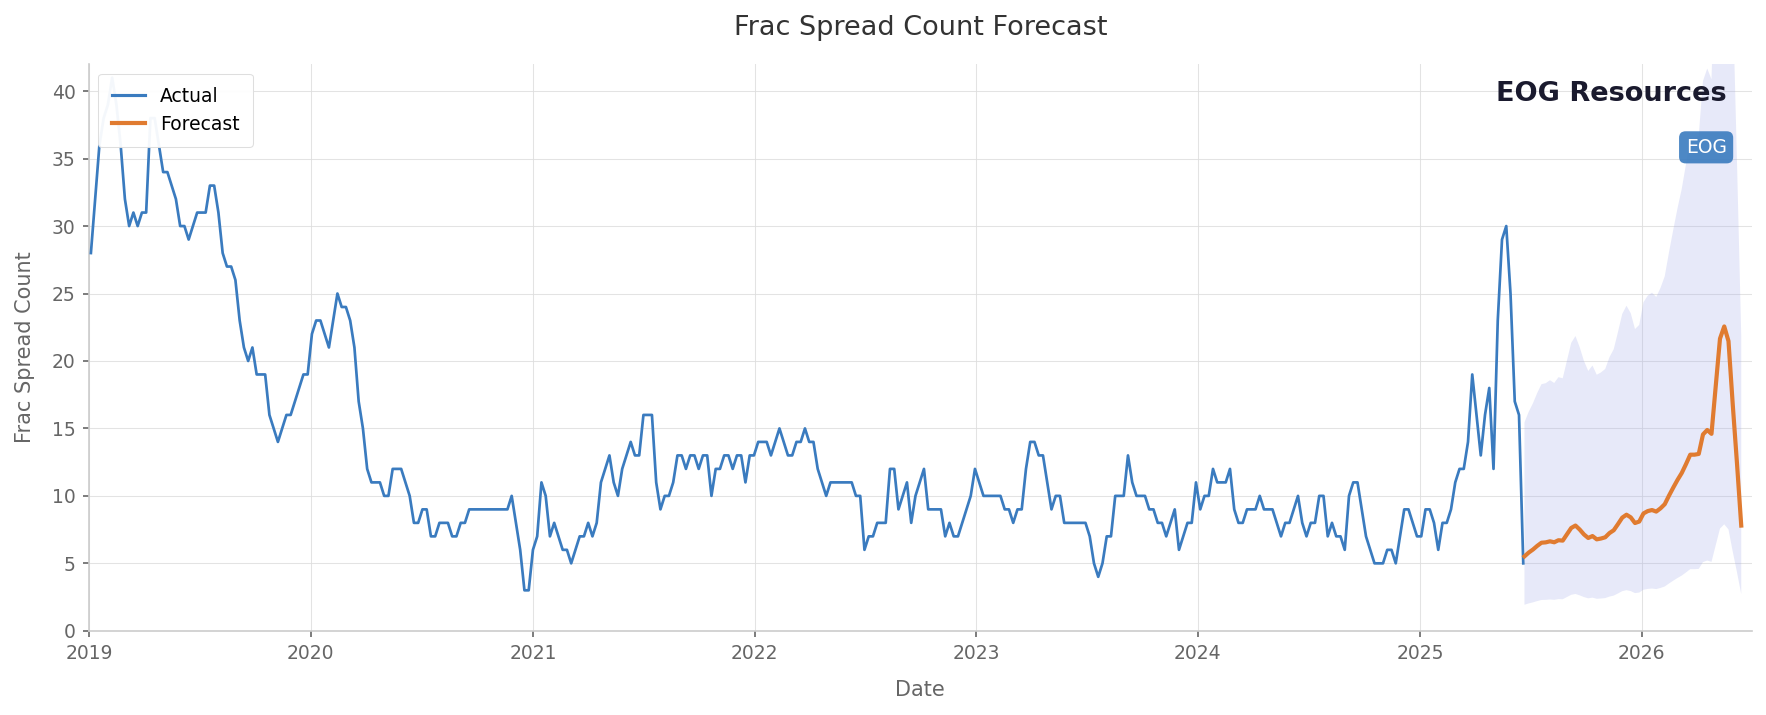
EOG Resources enters this period as the most operationally active of the three. The company plans to complete 585 net wells across its portfolio in 2026, running approximately 24 rigs and 10 completion crews, with activity split roughly evenly between the first and second halves of the year. That is a step down from the 645 net wells completed in each of the prior two years, but it comes alongside meaningful cost reduction — well costs in the Delaware Basin have fallen roughly 20% versus 2023 levels, bringing costs to at or below $725 per foot. Our Frac Spread Count forecast reflects this posture directly: a moderate baseline with episodic high-intensity windows rather than a sustained ramp. The wide 90% prediction bands, with upper bounds reaching into the low 40s in isolated weeks, capture the reality that EOG's campaign-style completion schedule creates bursts of demand that are difficult to predict at weekly resolution. Management has also signaled that much of the operational improvement in 2026 will come from refined completion techniques and longer laterals rather than a raw increase in spread count, which explains why the aggregate forecast does not show a dramatic step-change upward.
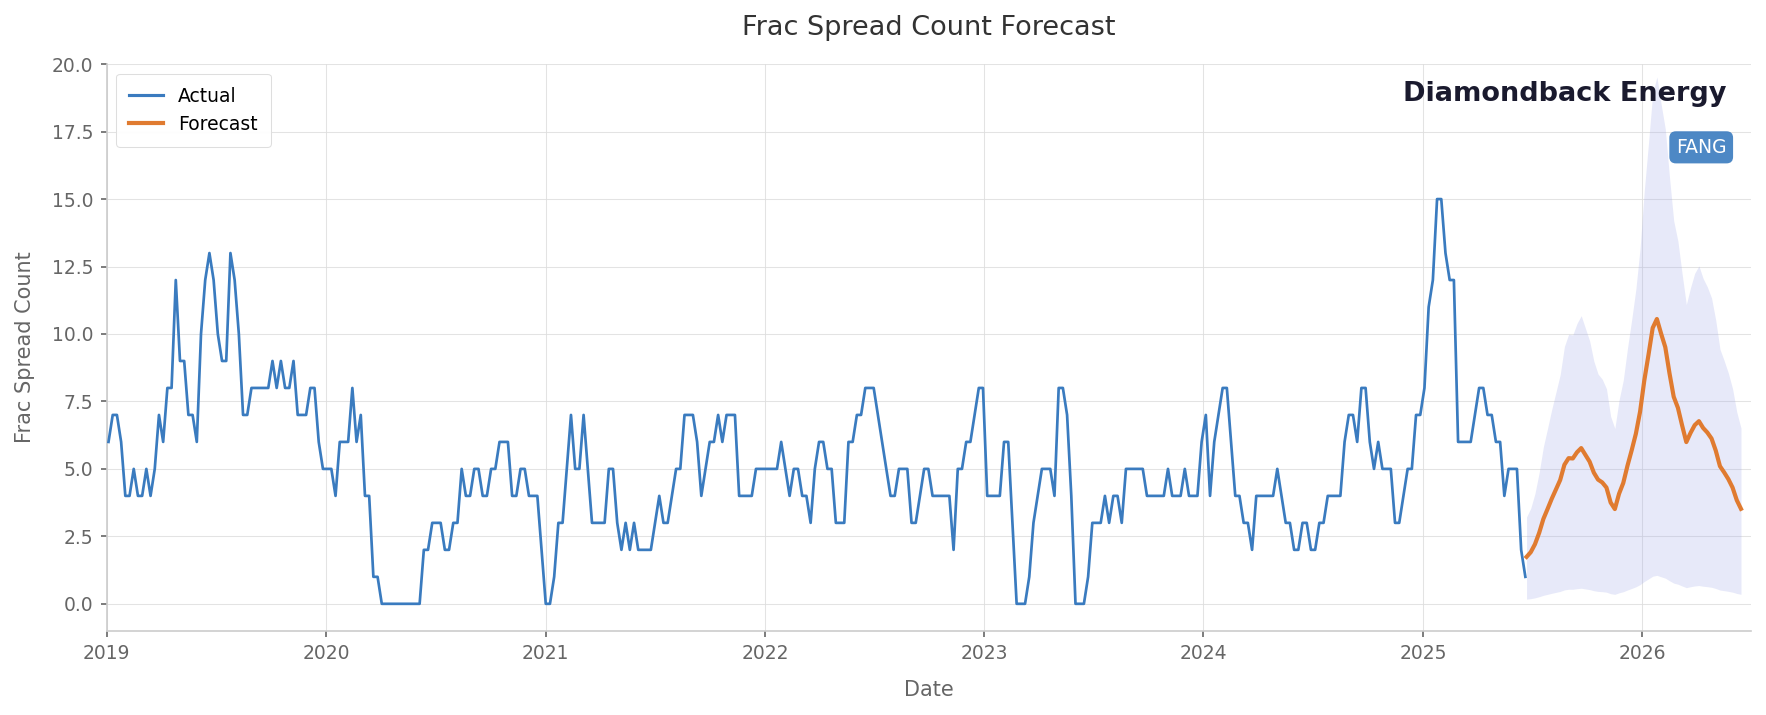
Diamondback Energy presents a different picture. The company's 2026 plan targets production of 500–510 MBO/d with cash capex of $3.6–$3.9 billion, holding activity roughly flat versus Q4 2025. That flat activity guidance is the critical phrase for interpreting our spread count forecast. The pronounced winter surge the model identifies — mean counts rising to approximately 8–10.6 in the late December 2025 to late January 2026 window — captures the post-Q2 2025 recovery as Diamondback rebuilt its completion pace after cutting a crew mid-year. Capital spending increased in Q4 2025 within the company's guided range, and management stated explicitly that it expects to maintain those activity levels throughout 2026. The subsequent normalization toward 3–6 spreads per week by mid-2026 is consistent with that steady-state flat posture. The wide confidence bands reflect that Diamondback's concentrated Permian position makes its spread count sensitive to any macro shift — a price move or a budget revision translates quickly into observable changes at the field level.
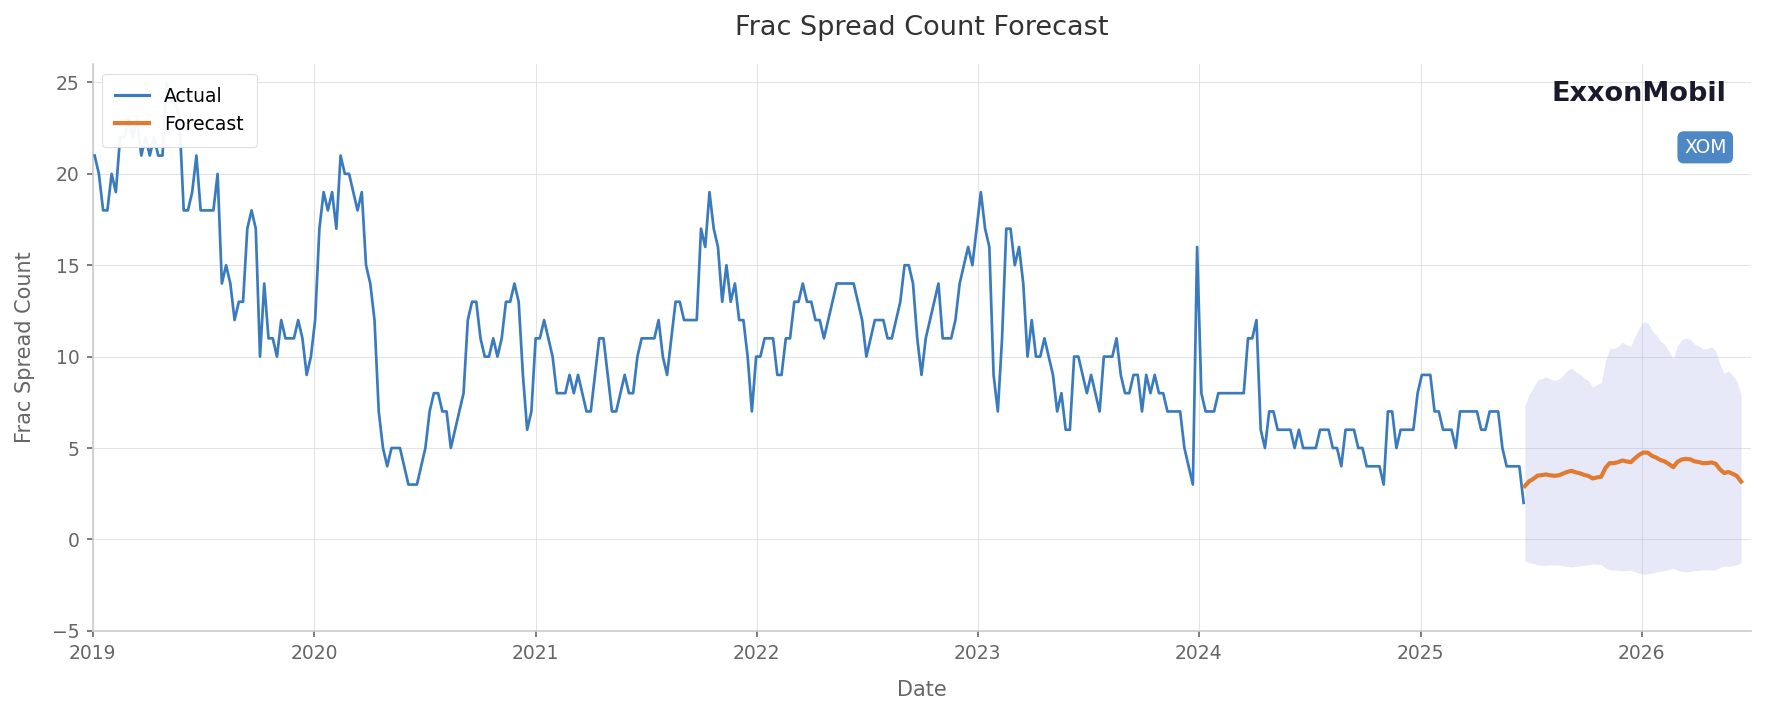
ExxonMobil's frac spread count profile is the most structurally distinct of the three. The model projects a low baseline of roughly 3–4 spreads per week through mid-2026, with modest upticks in late 2025 and early 2026 that do not materially alter the trend. This is not a reflection of reduced ambition in the Permian — the company has committed to deploying approximately $140 billion to major projects and its Permian Basin development program through 2030, with cash capex of $27–$29 billion in 2026 alone. It is instead a reflection of how XTO structures its operations. As a supermajor running an industrialized, factory-style completion program, ExxonMobil does not exhibit the campaign-style surges characteristic of pure-play independents. Spread count at weekly resolution remains low and stable because the scale of each individual spread is larger and the logistics are more tightly integrated. The company has also been directing Permian capital toward advanced completion techniques that improve per-well economics, meaning frac spread count as a standalone metric understates the actual completion intensity of its program.
Across all three operators, the data points in the same direction: flat to modestly declining spread counts, wide forecast uncertainty, and a clear preference for efficiency gains over activity increases. Our forecast reflects that with fidelity — moderate mean activity, high uncertainty bands, and material sensitivity to macro triggers. For service companies and investors tracking completion demand, average weekly spread counts will remain range-bound for these three operators, but the distribution of that activity is what actually matters.
Tags:
Permission denied
Upgrade to Pro Today and get…
• This article — plus dozens more each month, all within our full Research Module
• Frac Hits — our National-Level Frac Spread Count and Frac Job Count, updated weekly
• Frac Operator Monitor — detailed FSC & FJC by operator
• And so much more, designed to help you track, forecast, and outperform


