

Articles
- BLOG / Articles / View
- Articles
Monday Macro View: Which Basins Are Actually Driving the Rise in Frac Spreads?
By Osama on June 1, 2026 in Market Sentiment
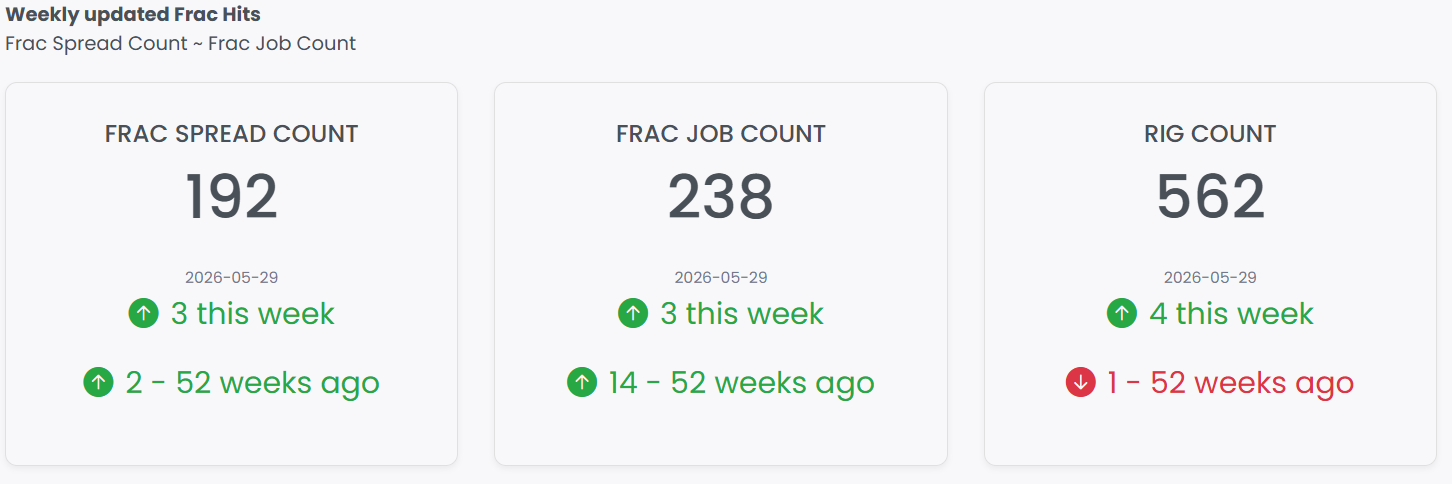
Primary Vision's data for the week ending May 29 shows the Frac Spread Count coming in at 192, up 3 from the prior week, while the Frac Job Count registered 238, also up 3 week-on-week. Both metrics are tracking modestly above their readings from 52 weeks ago — FSC up 2 and FJC up 14 on that same year-over-year basis — which tells you that the completion market is holding its ground even in a price environment that has kept capital discipline firmly in place. That year-over-year FJC delta of 14 is worth noting separately: it suggests that while the number of active spreads has stayed relatively flat, the jobs being executed per spread have increased, pointing to improved crew utilization and efficiency across the basin. This made me want to dig deeper into which specific basins are actually driving activity and where the divergence is most pronounced.
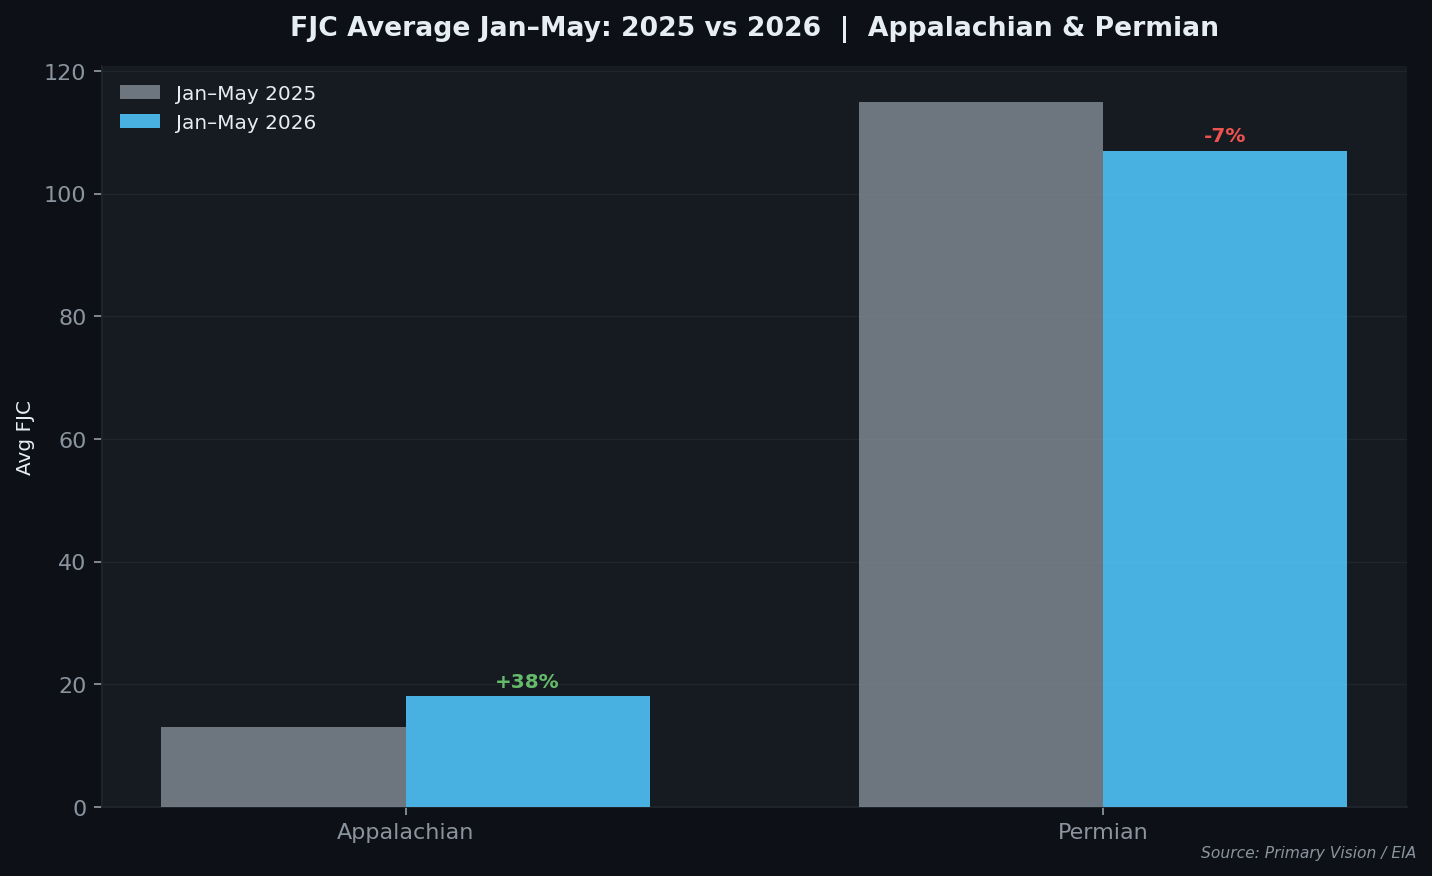
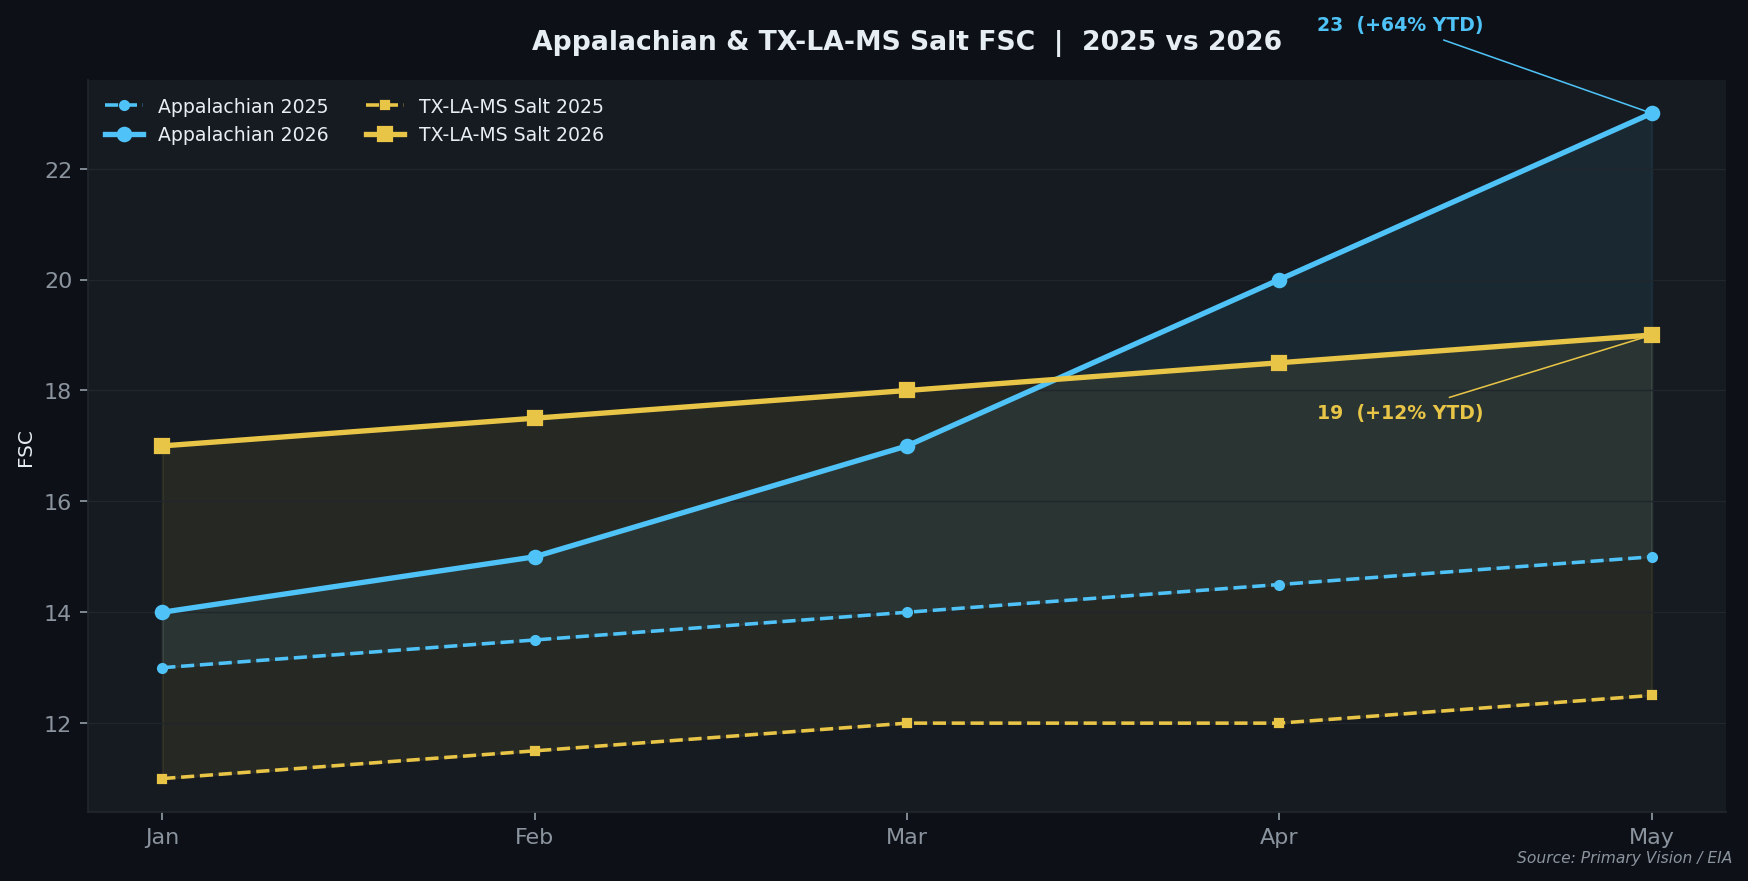
The Appalachian basin stands out as one of the clearest stories of accelerating activity in 2026. FSC averaged 14 spreads across January through May 2025. Over the same period in 2026, that average has risen to 17.5 — a year-on-year increase of roughly 25%. More telling is the trajectory within the year itself: FSC opened 2026 at 14 spreads and has climbed to 23 by the end of May, a gain of 64% in under five months. The FJC tells a similar story, rising from an average of 13 in early 2025 to 18 in the equivalent 2026 window, a 38% increase. Appalachia is a gas-weighted basin, and this acceleration is consistent with the strong natural gas price environment and the growing pull from LNG export demand on the East Coast corridor.
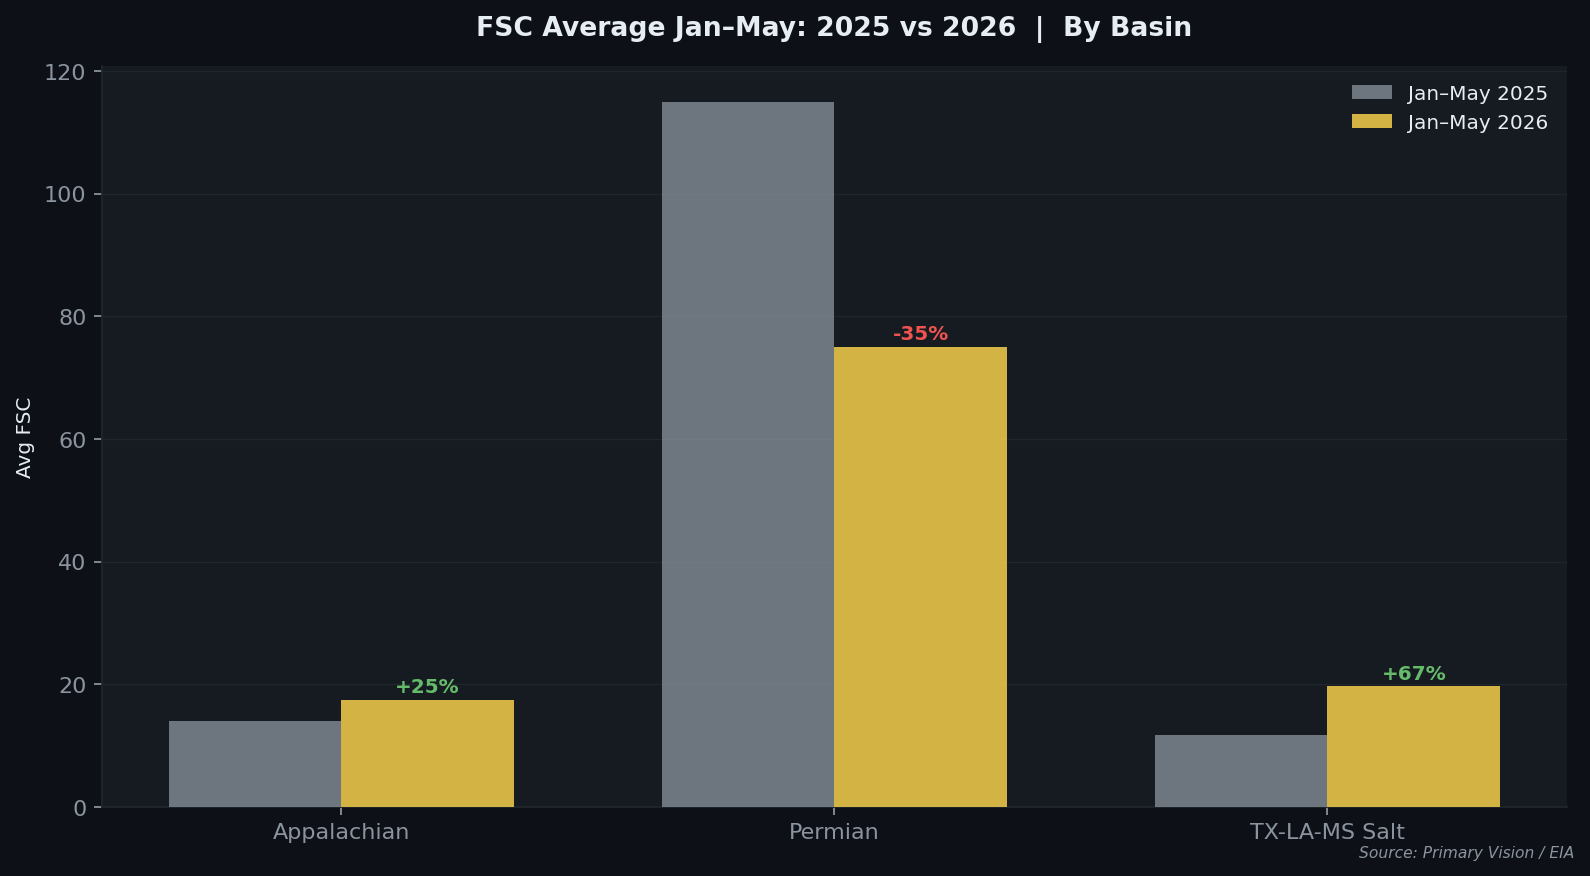
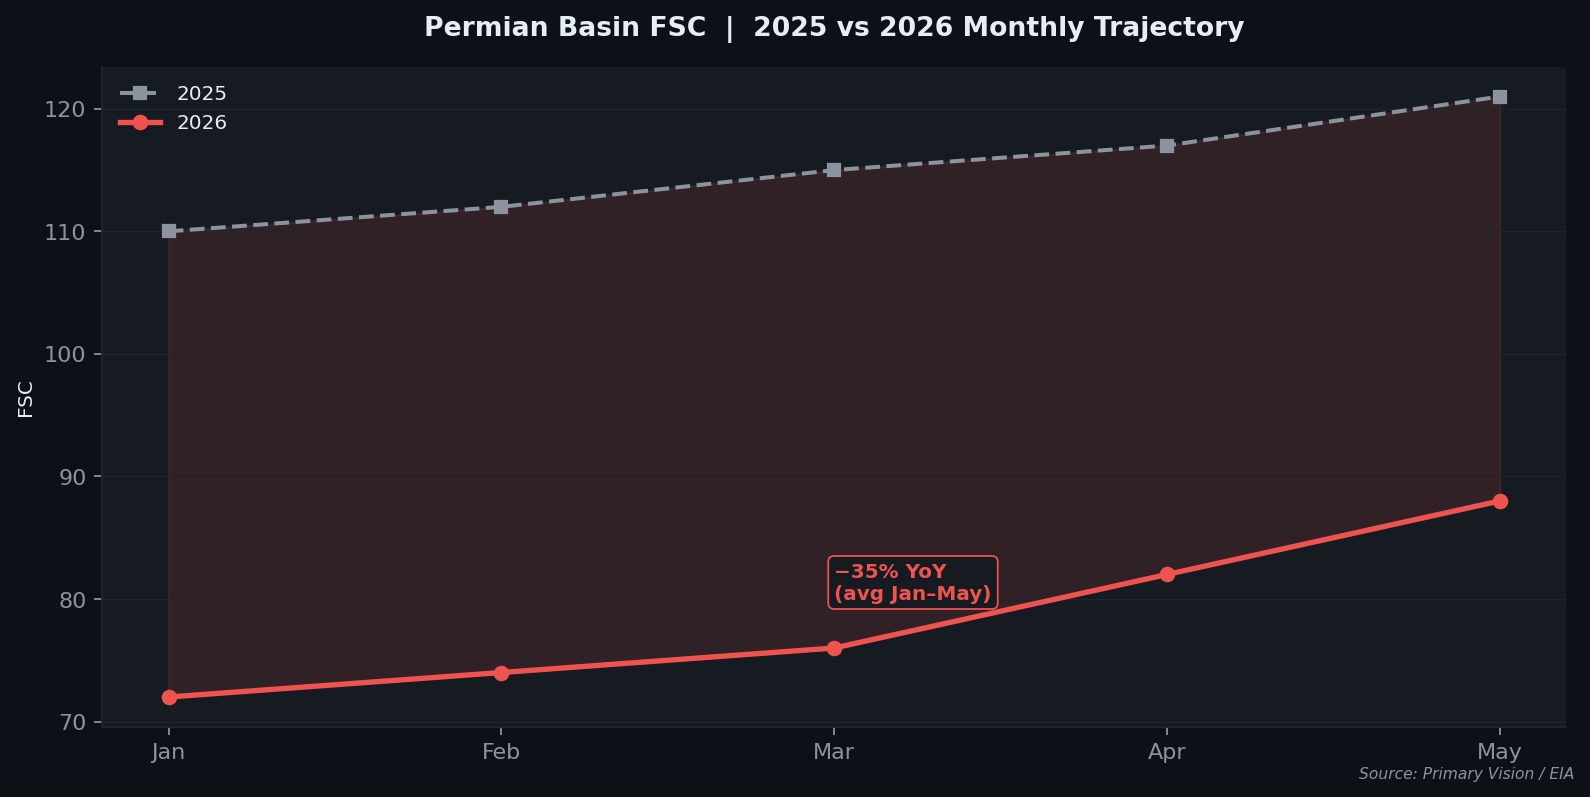
The Permian Basin moves in the opposite direction and deserves careful reading. FSC averaged 115 spreads from January through May 2025. That figure has dropped to 75 over the same window in 2026 — a year-on-year decline of roughly 35%. The basin opened 2026 at 72 spreads and has recovered to 88 by end of May, a partial rebound of about 22% within the year, but still well below where it was a year ago. FJC has followed a similar path, declining from an average of 115 in early 2025 to 107 in 2026, a drop of about 7%. The Permian decline is not a signal of structural retreat so much as a recalibration — operators consolidating acreage post-merger, optimizing DUC inventories, and waiting for the forward price curve to justify new drilling commitments at scale.
TX-LA-MS Salt — Primary Vision's label for the salt basin region spanning east Texas, Louisiana, and Mississippi, which broadly overlaps with the Haynesville Shale gas play — shows one of the more pronounced positive moves in the dataset. FSC averaged 11.75 spreads from January through May 2025 and has risen to 19.65 over the same period in 2026, a year-on-year increase of approximately 67%. The intra-year movement adds further context: FSC opened 2026 at 17 and ended May at 19, a gain of around 12% within the year alone. This basin is responding directly to natural gas fundamentals — Haynesville is among the most cost-competitive dry gas plays in the country, and with Henry Hub holding above $3.50 and LNG export capacity expanding, the economics of accelerating completions here are relatively straightforward.
The aggregate national picture — 192 spreads and 238 jobs as of May 29 — therefore masks a meaningful internal rotation. Gas-weighted basins like Appalachia and TX-LA-MS Salt are seeing sustained and in some cases accelerating activity, while the Permian, which dominates crude oil completion volumes, remains below its prior-year pace even as it trends upward from its 2026 lows.
 The EIA's May 2026 STEO projects U.S. crude production holding at 13.65 million b/d for 2026, with natural gas output growth led by the Permian and Haynesville. The national DUC count, meanwhile, has hit a record low — bottoming just under 4,000 wells before a slight recovery to 4,100 in late May. In the Permian specifically, Primary Vision's basin-level data alongside the EIA's Drilling Productivity Report put the Permian's DUC inventory at around 893 wells as of March 2026. Primary Vision's FSC data shows the Permian running 35% below its year-ago pace, which is broadly consistent with a basin drawing down rather than building inventory. Appalachia and TX-LA-MS Salt, however, tell a different story — both show sharp FSC acceleration in 2026, yet their DUC counts have not seen equivalent commentary in the EIA's Drilling Productivity Report, suggesting the completion activity there is being fed by fresh drilling rather than backlog drawdown.
The question worth asking now is not whether U.S. shale can respond to higher prices — it demonstrably can — but how long that response actually takes given where the DUC inventory sits. Six months ago, operators could accelerate completions within weeks. That optionality is largely gone. What that means practically is that even if the forward curve moves convincingly above $80, the production response will be measured in quarters, not weeks. Gas basins will continue pulling ahead in the interim, driven by LNG demand that exists independent of oil price volatility. The Permian will follow, but on its own timeline.
Tags:
Permission denied
Upgrade to Pro Today and get…
• This article — plus dozens more each month, all within our full Research Module
• Frac Hits — our National-Level Frac Spread Count and Frac Job Count, updated weekly
• Frac Operator Monitor — detailed FSC & FJC by operator
• And so much more, designed to help you track, forecast, and outperform


