






Articles
- BLOG / Articles / View
- Articles
Enterprise Subscribers: Saudi Oil Exports to U.S. Hit Zero
By Osama on August 10, 2026 in Market Sentiment
This week's national frac spread counts came in at 196 for FSC and 240 for FJC, both up from where they started the year — FSC at 156 and FJC at 195 back in January. Neither count has had a down month since spring. The aggregate number is fine, but it hides two of the more interesting moves of the year underneath it, so let's get into the basin-level detail.
Start with the Permian, since it's the one everyone already watches. It added the most frac spreads of any basin this year, from 72 in January up to 89 last week. What's less obvious is why the timing lines up the way it does — industry trackers now describe the Permian as the single basin absorbing most of the production response to the Middle East supply shock we'll get to below, since it's the one place in the country with enough spare completion capacity to move fast. That's also showing up on the service side: ProPetro told investors last week that frac equipment supply in the Permian has tightened enough to support firmer pricing into the second half of the year. I believe that Permian will see further upward movement to 115 in 2027 before plateauing. Future direction will of course depend on the overall economic milieu.
.png)
Williston hasn't moved all year. Fourteen spreads in January, fourteen in August, fourteen every Friday in between — 31 straight weeks, flat or consistent, in a dataset where every other basin wobbles with weather or pad timing. That matches on-the-ground reporting all year: Bakken activity has settled into a plateau in the low-to-mid 20s for rigs, and a recent operator survey of the basin put it plainly — Williston is turning out to be a high-efficiency, cash-generating basin. We can expect continued activity for several next weeks in this basin as well.
.png)
Appalachian is the one I'd flag hardest. It went from 14 spreads to 25 — up 79%, the biggest percentage gain on the board, bigger in relative terms than the Permian's move even though the Permian added more spreads outright. I've covered the data-center demand pull behind this move in a previous update, so here's the part that's new: Whether we will see Appalachian topping out right around where it already sits, depends on the current geopolitical scenario and data center demand. May be this year's near-doubling has already captured the demand response, and what's ahead is a higher plateau, not a second leg up. This is a factor I will be watching very closely.
.png)
Now to the bigger story of the week. DOE data confirmed U.S. imports of Saudi crude were zero for the entire month of July — the first full calendar month with no Saudi barrels since 1985. Earlier this year we were still bringing in more than 800,000 barrels a day from Saudi Arabia. Seven months, over 800,000 barrels a day to nothing. The cause is the Iran conflict shutting down flows through the Strait of Hormuz, and refiners are talking about it openly. Phillips 66's CEO said Middle Eastern crude is now under 1% of what they're running, down from a meaningful share a year ago. When a refiner says that on an earnings call, they've already rebuilt their supply chain around it.
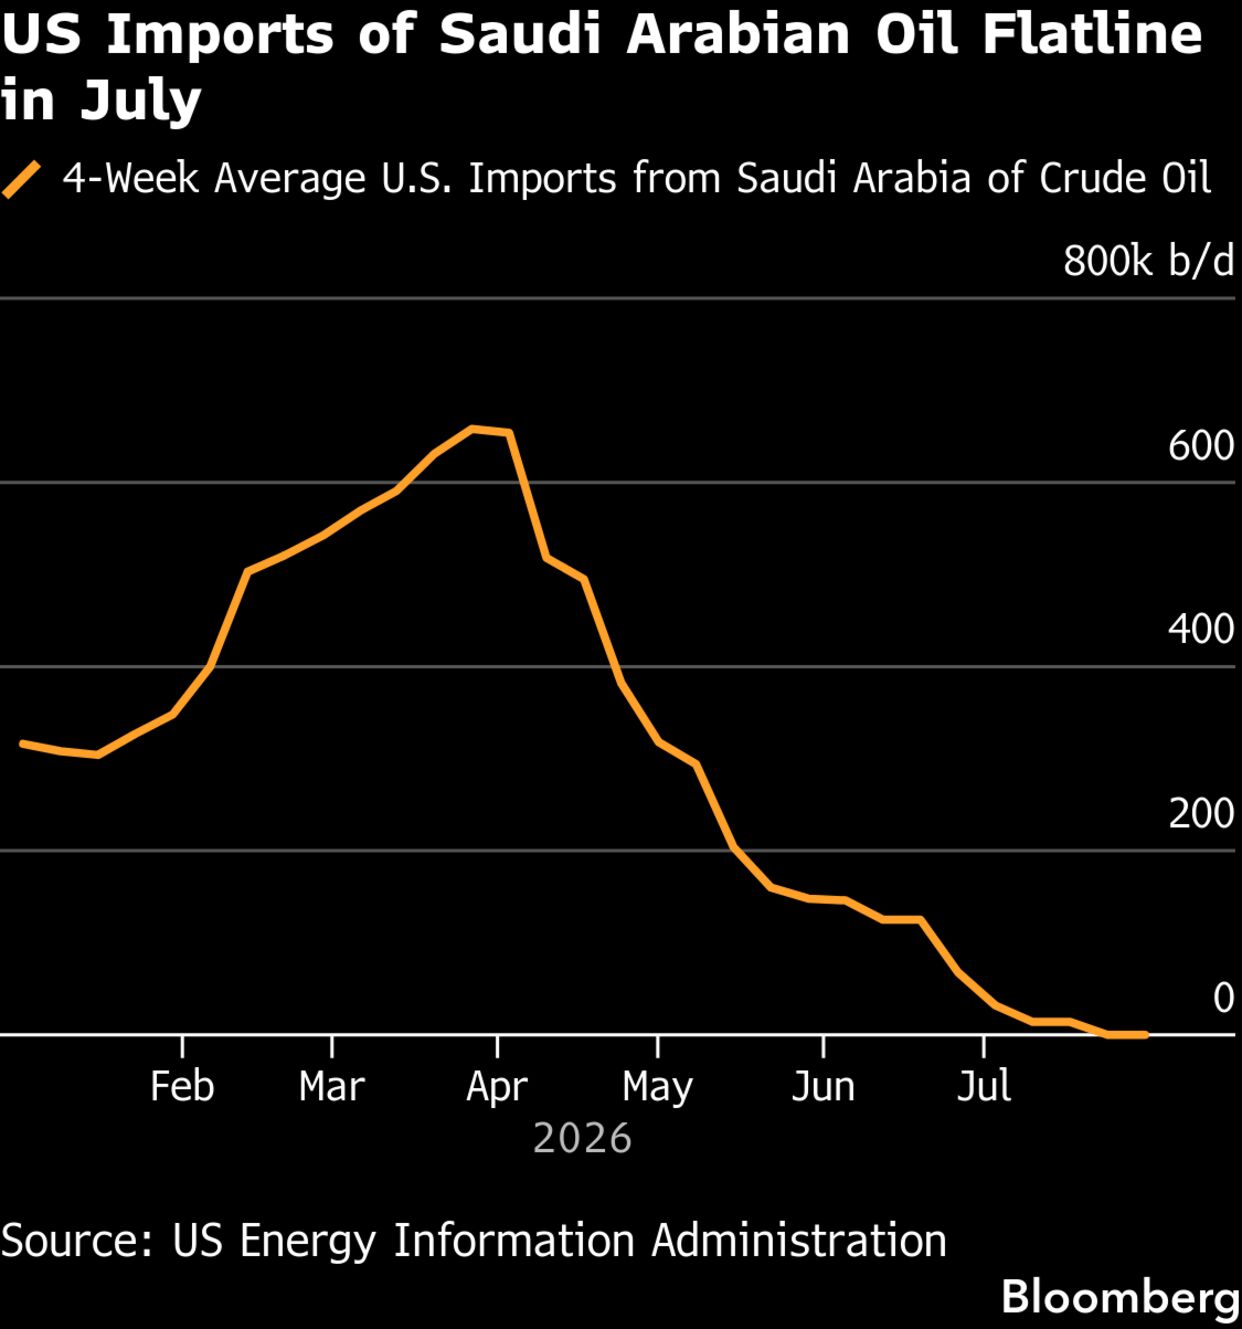
Mostly it's Venezuela filling the gap. U.S. refiners took roughly 600,000 to 670,000 barrels a day of Venezuelan crude in July, up from about 100,000 barrels a day in January — a sixfold jump in seven months, from a country that isn't exactly known for reliable supply. Canada is the real backbone underneath all of this, steady at 3.6 to 3.8 million barrels a day and largely untouched, which is why the system hasn't felt this more. Brazil, Colombia, and Ecuador have each picked up smaller amounts in the 200,000 to 270,000 range. Iraq has gone to zero on some weeks too, so this isn't a Saudi-only problem, it's a Gulf-transit problem. One caveat: Kpler's tracking data has Saudi barrels coming back to around 300,000 a day this month, so July's zero might be the trough rather than a permanent break.
Nobody in Riyadh or Midland is reading a frac spread sheet before they set next quarter's budget. They should be. The completions data moved first, moved quietly, and moved right — which means the real trade isn't betting on the war's next headline, it's betting on who reads crew counts before the headlines write themselves.
Tags:
Permission denied
Upgrade to Pro Today and get…
• This article — plus dozens more each month, all within our full Research Module
• Frac Hits — our National-Level Frac Spread Count and Frac Job Count, updated weekly
• Frac Operator Monitor — detailed FSC & FJC by operator
• And so much more, designed to help you track, forecast, and outperform