The Frac Efficiency Rise: Fewer Spreads, More Work
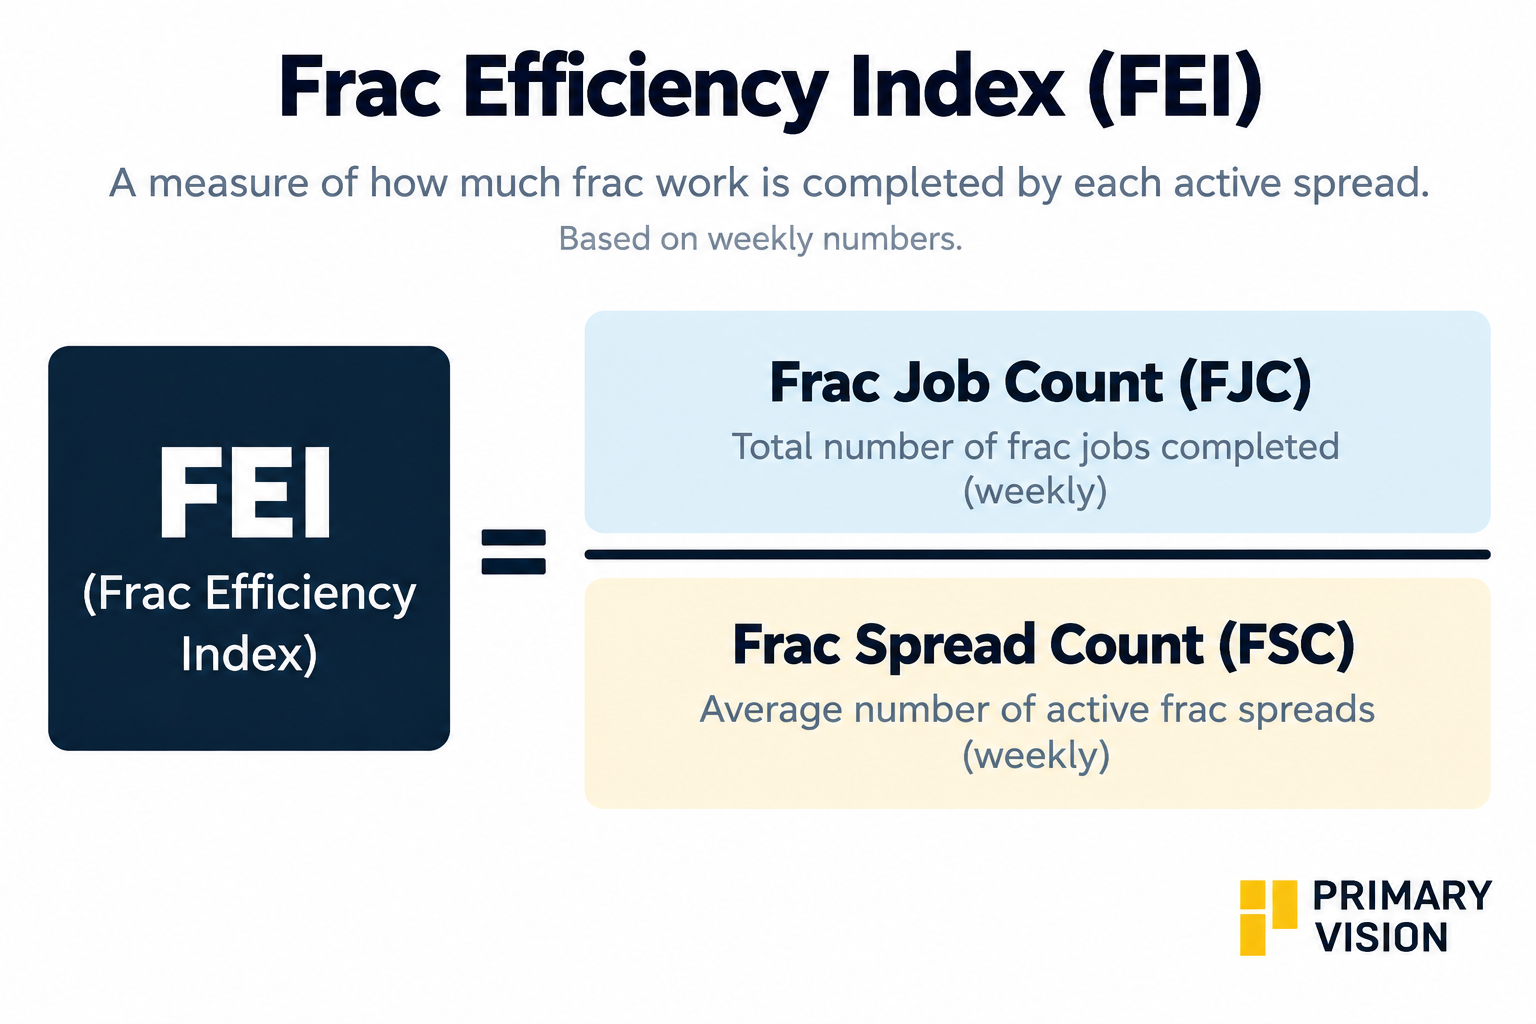
The U.S. frac market is entering a different phase. The active fleet is much smaller than it was several years ago, yet frac activity has held up far better than spread counts. That raises a timely question: if operators can now accomplish more work with fewer spreads, how much does a change in oil prices actually need to affect the physical frac fleet? The Frac Efficiency Index (FEI) helps answer that by measuring jobs per active spread.
2020 Was the Wrong Kind of Efficiency
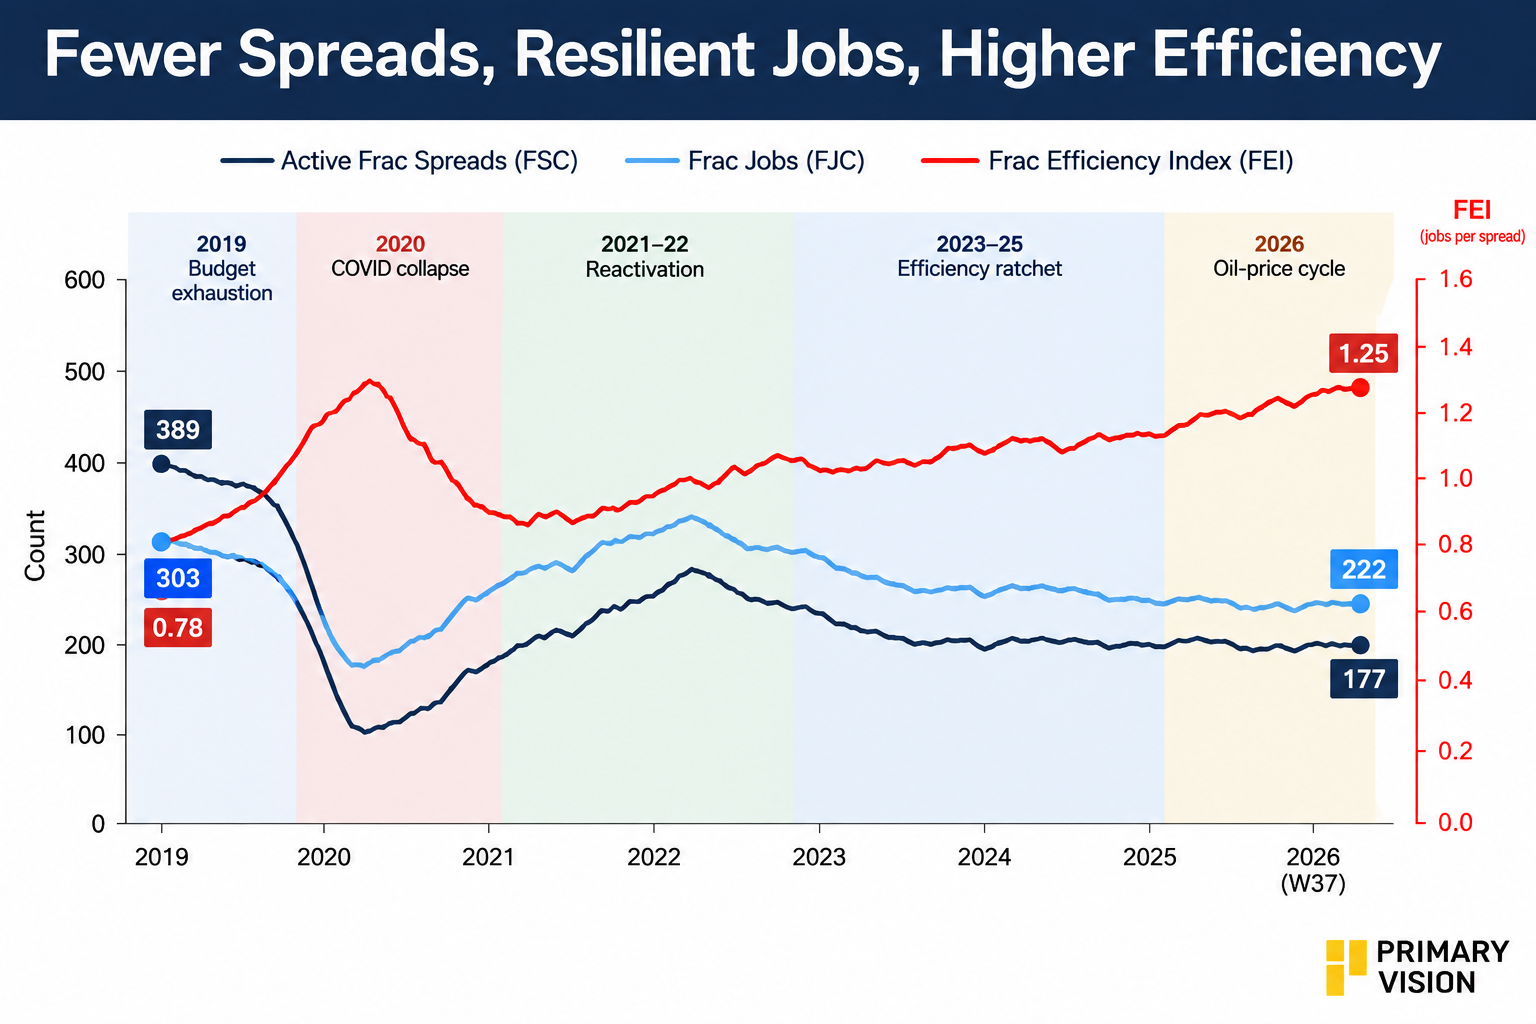
The long-term numbers are striking. Since 2019, active frac spreads have fallen roughly 55%, while frac jobs have declined only 27%. FEI has consequently risen from 0.78 to 1.25.
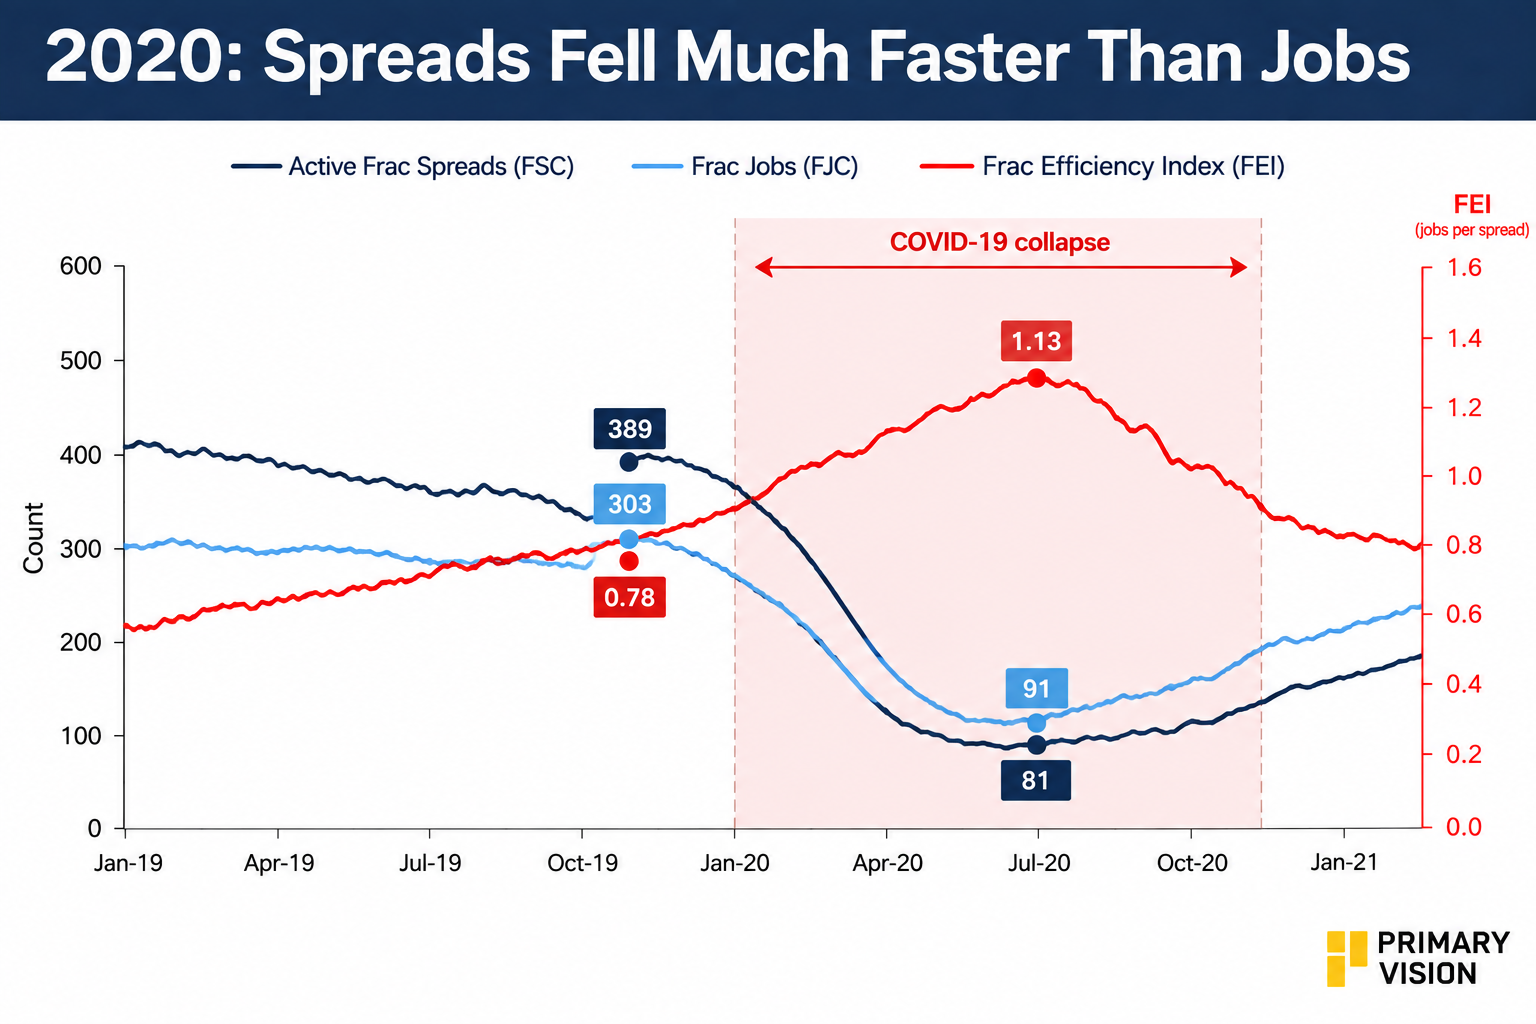
But higher FEI does not automatically mean better productivity. The 2020 collapse shows why. Active spreads fell 79%, while frac jobs dropped 70%, pushing FEI up 44%. That was largely a fleet-shutdown effect. Equipment was idled faster than work disappeared.
The post-2022 experience looks different.
The Ratchet Emerged After 2022
Between 2023 and 2025, active spreads declined about 40%, but frac jobs fell only 13%. FEI increased roughly 44%. This time, the industry was not dealing with a sudden collapse in demand. Operators were getting more work from a smaller active fleet.
Halliburton has discussed greater use of continuous pumping and simul-frac, while Liberty has highlighted fleet rationalization and higher utilization of its remaining equipment. Diamondback has also discussed productivity gains from continuous-pumping and e-fleet simul-frac operations.
E&P consolidation is another piece of the story. Activity is increasingly concentrated among larger operators and more productive programs, while older or less competitive equipment has exited the active fleet. The result is a smaller fleet with a greater proportion of higher-specification equipment.
The Basin Data Strengthen the Case
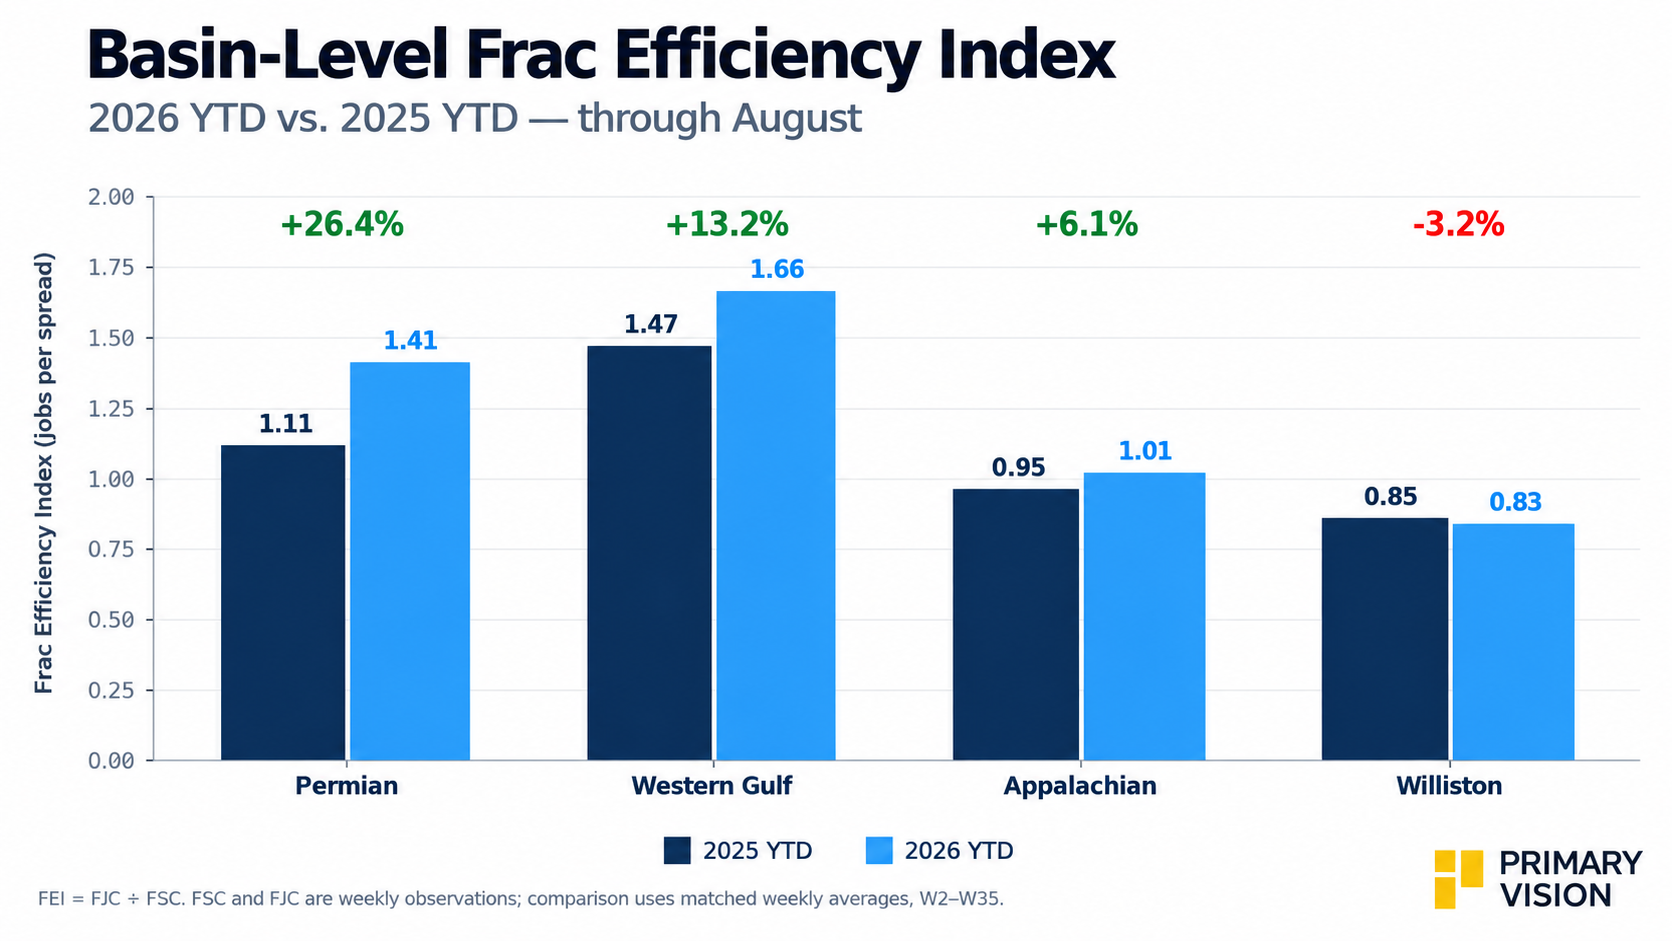
Across the four comparable basins, FEI rose between 2024 and 2026. The Permian is the clearest example. Spreads fell 41%, but jobs increased 9%, lifting FEI from 0.76 to 1.41. The basin accounts for roughly 82% of the measured efficiency effect, indicating that fleet rationalization and higher utilization are important drivers.
The Western Gulf shows a similar pattern, with fewer spreads supporting higher activity and a roughly 50% increase in FEI. Appalachia is different: FEI improved even as its spread count increased, suggesting that stronger job growth, rather than fleet reduction, drove the gain.
Williston remains the exception, with both spreads and jobs declining and FEI essentially flat. The broader point is that efficiency gains are coming from different mechanisms across basins, rather than from fleet reduction alone.
The Bottom Line
The 2023–25 efficiency ratchet appears structural, with national and basin-level data supported by documented changes in fleet configuration, continuous pumping, simul-frac and fleet rationalization.
The next question is whether that ratchet survives weaker oil prices. That is where the 2026 data become particularly important.
Upgrade to Pro Today and get…
• This article — plus dozens more each month, all within our full Research Module
• Frac Hits — our National-Level Frac Spread Count and Frac Job Count, updated weekly
• Frac Operator Monitor — detailed FSC & FJC by operator
• And so much more, designed to help you track, forecast, and outperform