







Articles
How does this end?
By Osama on September 2, 2026 in Free Articles
I have discussed the rise in global bond yields before, but I wanted to return to it this week because the move now deserves a closer look, especially as higher yields are appearing across several major markets at the same time and are starting to interact with inflation, growth, fiscal pressure and the flow of capital between countries.
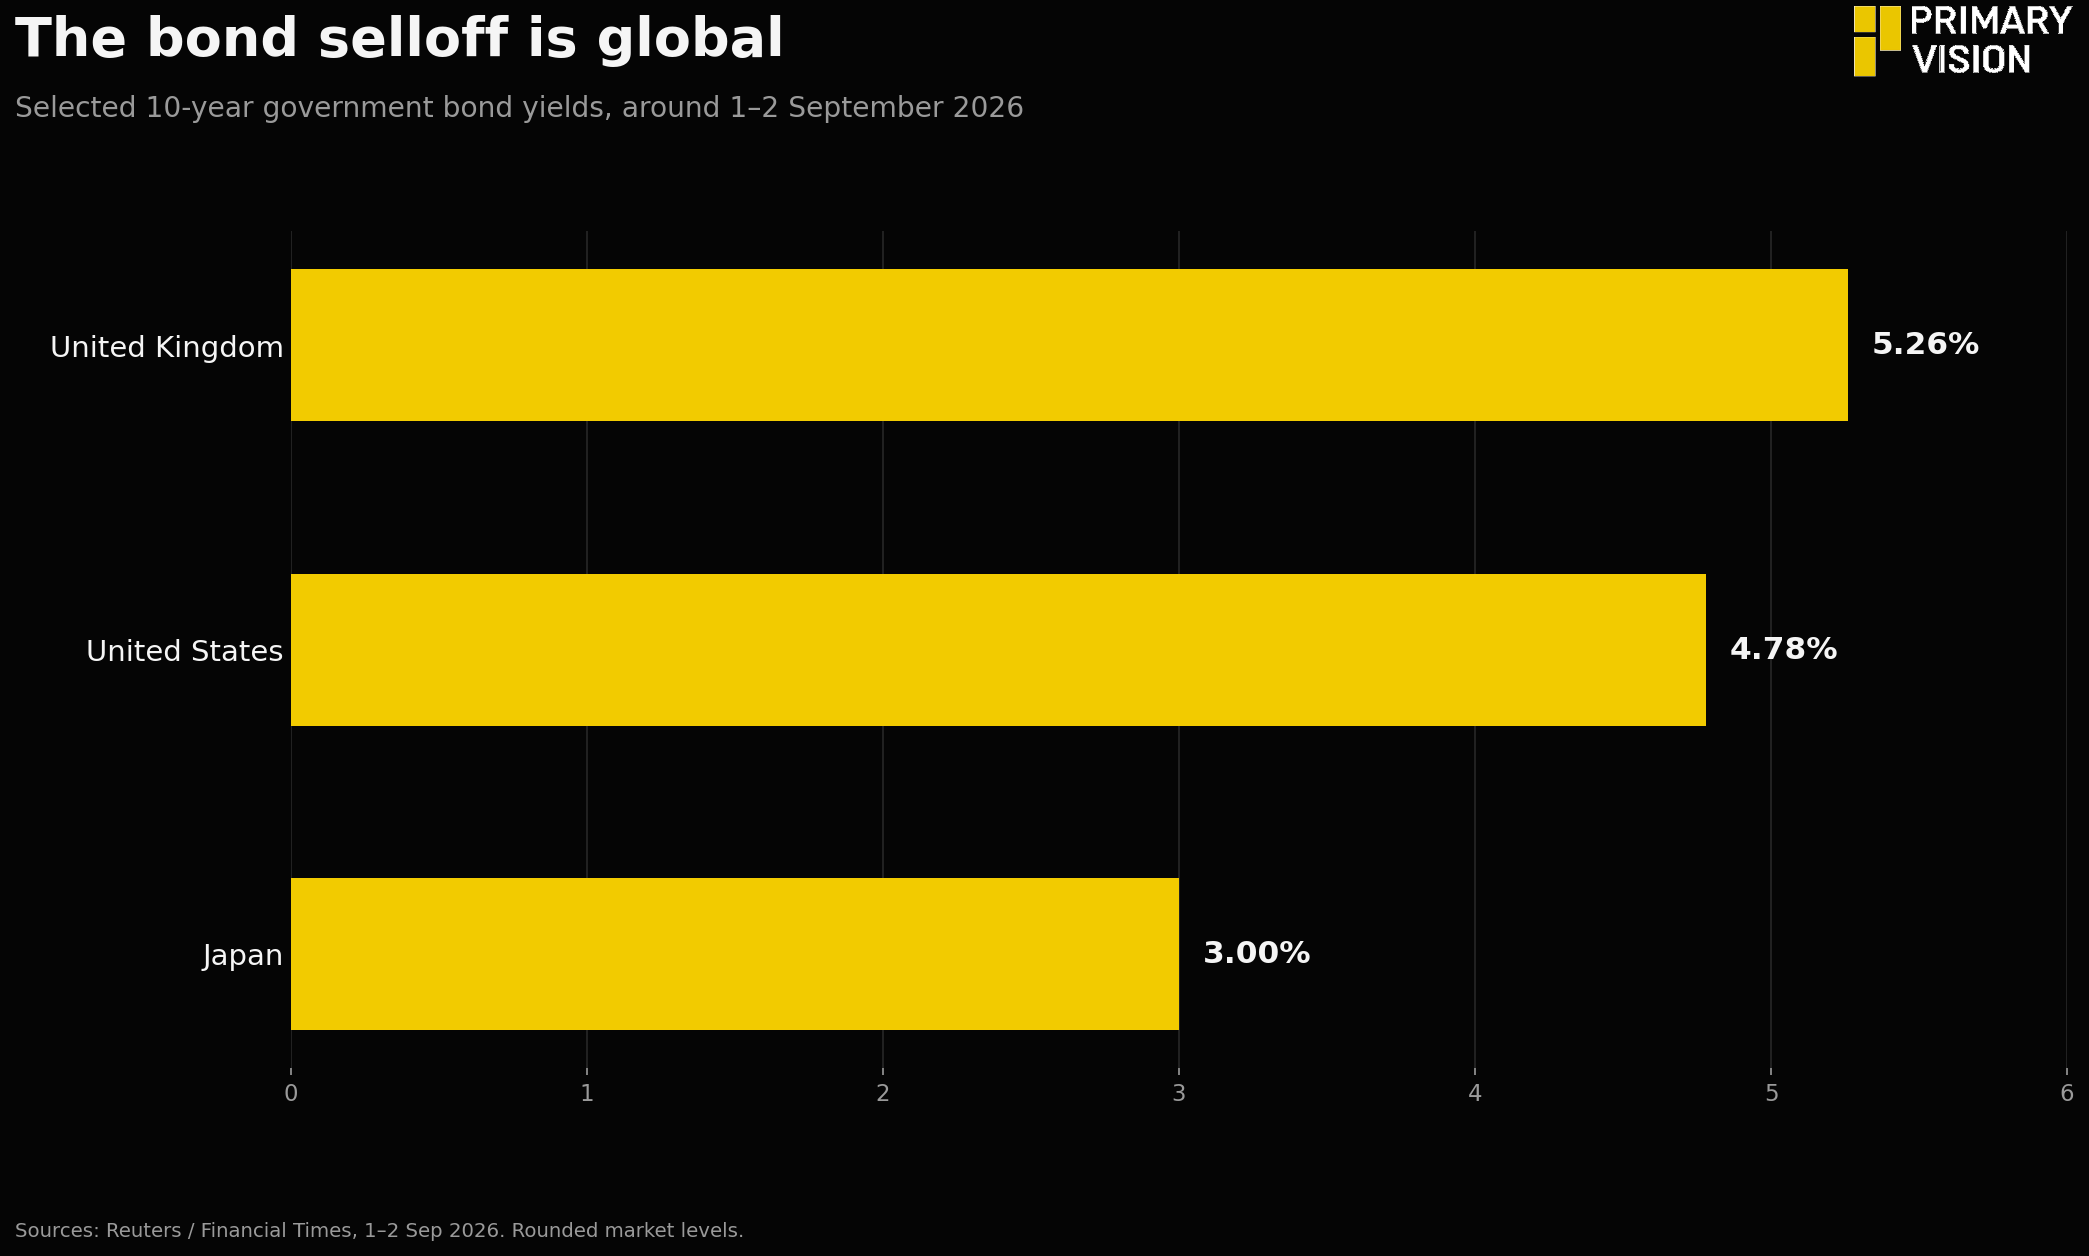
Japan has drawn plenty of attention after its 10-year government bond yield crossed 3% for the first time since 1996, while the U.S. 10-year has moved toward 5%, British yields remain elevated, and long-term borrowing costs across parts of Europe have climbed as well. At the same time, governments are issuing large amounts of debt, oil prices have added another layer of inflation concern, and central banks are still trying to judge how much further they can ease without allowing price pressures to strengthen again.
The question I keep coming back to is simple: how do episodes like this end?
So as always, I tried to look into my crystal ball, but one that tells the past. The 1994 U.S. episode is still one of the clearest starting points. The 10-year rose from about 5.75% to nearly 8%, roughly 220 basis points in ten months, while the Fed tightened aggressively. Growth was strong, unemployment was falling and government debt was far lower than today, which gave the economy much more room to absorb higher borrowing costs. Japan’s 1998–99 move is especially relevant because yields rose even as the economy was weak. The 10-year JGB yield climbed from roughly 0.9% in October 1998 to above 2% by early 1999, while Japan was dealing with deflation, fragile growth and government debt that was already rising quickly. Concerns around fiscal expansion and bond supply became important enough to overpower the weak macro backdrop. Then came the 2003 global selloff, when Japan’s 10-year rose from around 0.4% in June to roughly 1.6% by September, a move of about 120 basis points in three months. U.S. and European yields also rose sharply. Japan’s debt burden was already very high, but inflation remained weak, so the move was driven more by improving growth expectations and crowded positioning than by an outright fiscal crisis. The 2013 taper tantrum gives us another useful U.S. comparison. The 10-year jumped from 1.63% to 2.74% in barely two months, while U.S. public debt had already risen sharply from pre-crisis levels. Inflation was low and unemployment was still elevated, which meant the selloff came mainly from markets suddenly pricing in less Fed support. A final useful case is the 2022 U.S. Treasury selloff, when the 10-year moved from around 1.5% at the start of the year to above 4% by October. This time inflation was the dominant force, the Fed was tightening rapidly and U.S. debt was already above 100% of GDP on a gross basis. That made the rise in yields much more painful because higher rates were landing on a far larger debt stock than in 1994.
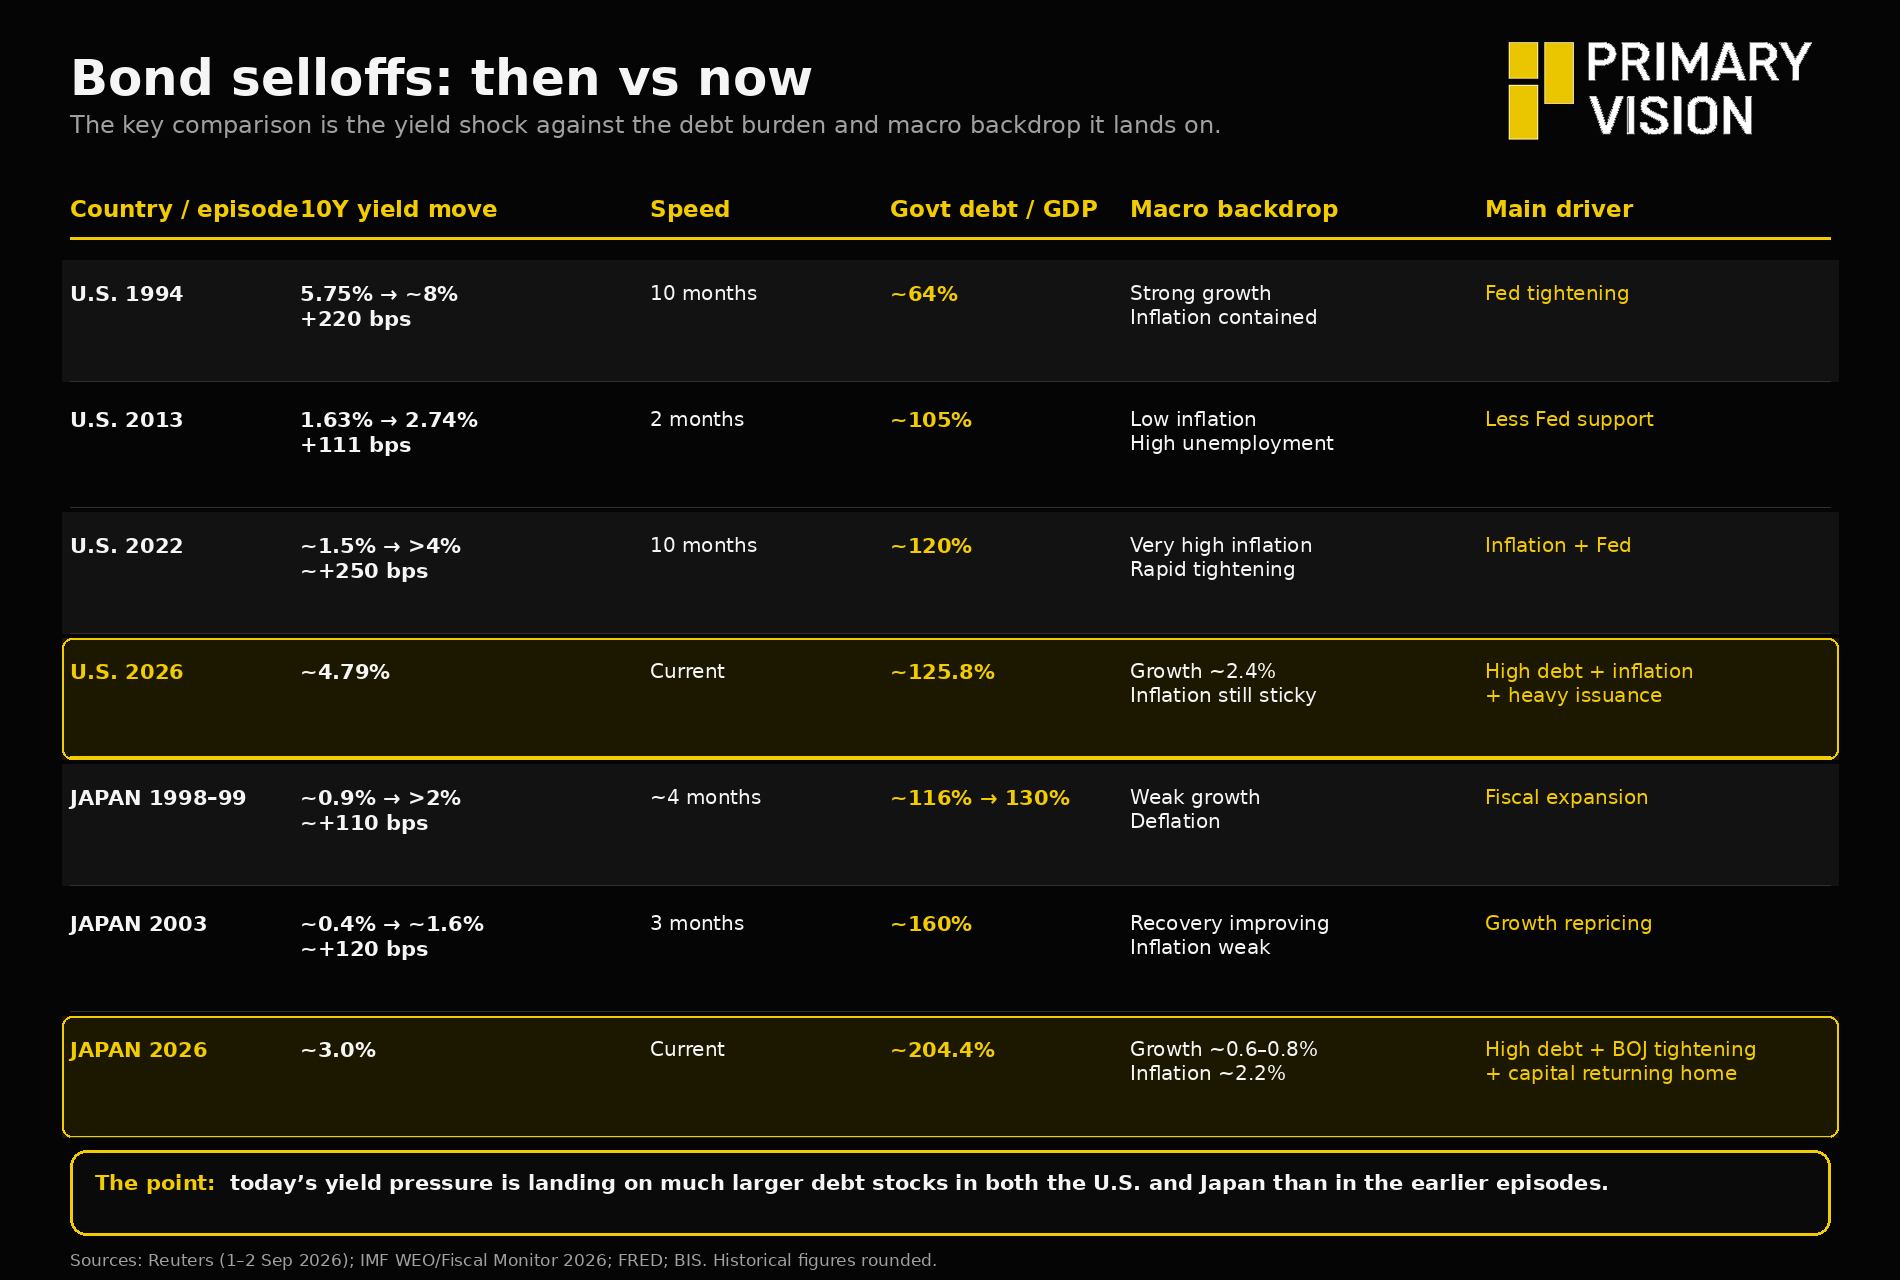
This gives you a much cleaner progression: 1994 shows what happens when the economy is strong and debt is relatively low; 1998–99 Japan shows fiscal pressure overpowering weak growth; 2003 shows a violent repricing from ultra-low yields; 2013 shows the effect of removing central-bank support; and 2022 shows what happens when high inflation meets high debt.
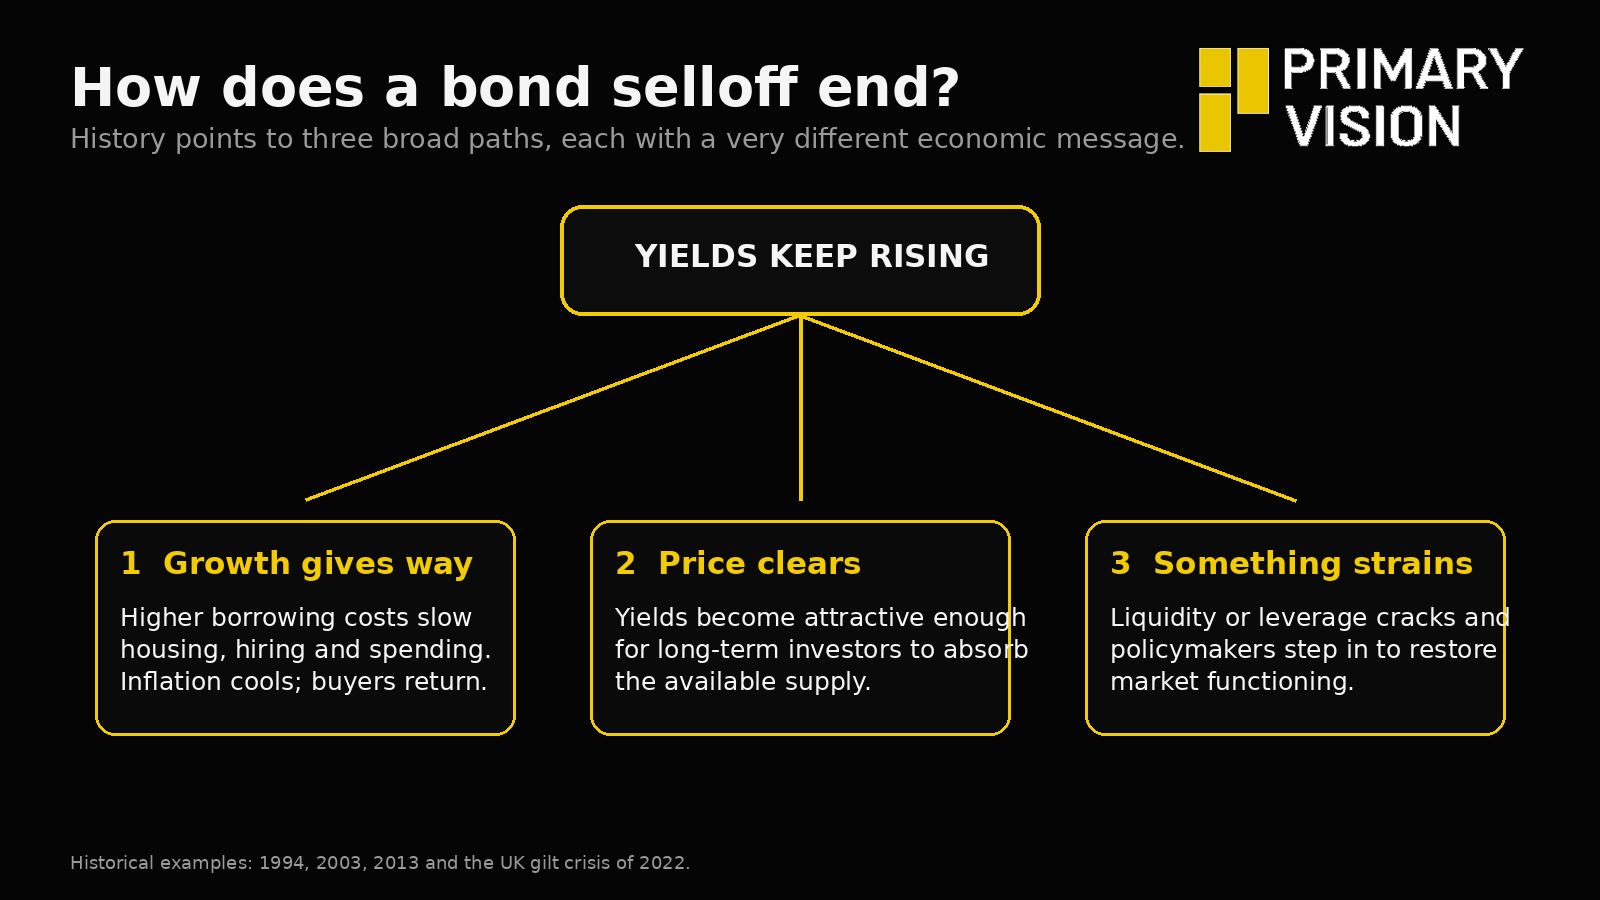
Taken together, the five episodes show that each past selloff had a fairly clear driver: Fed tightening in 1994, fiscal and supply concerns in Japan in 1998–99, a sharp growth repricing in 2003, the withdrawal of Fed support in 2013, and inflation plus aggressive tightening in 2022. Today, several of those pressures are present at once — sticky inflation, heavy government borrowing, high yields across major markets, reduced central-bank support and the possibility that more Japanese capital stays at home.
That combination gives the current move more ways to become disorderly. Higher yields could weaken growth, make government debt harder to finance, reduce demand for new bond supply, or expose stress among leveraged investors. The worrying part is that there is no single pressure point to watch this time; several could start feeding into each other.
Tags: