Market Sentiment Tracker: Oil prices - has the war premium really gone?
By
Osama
on June 30, 2026
in
Market Sentiment
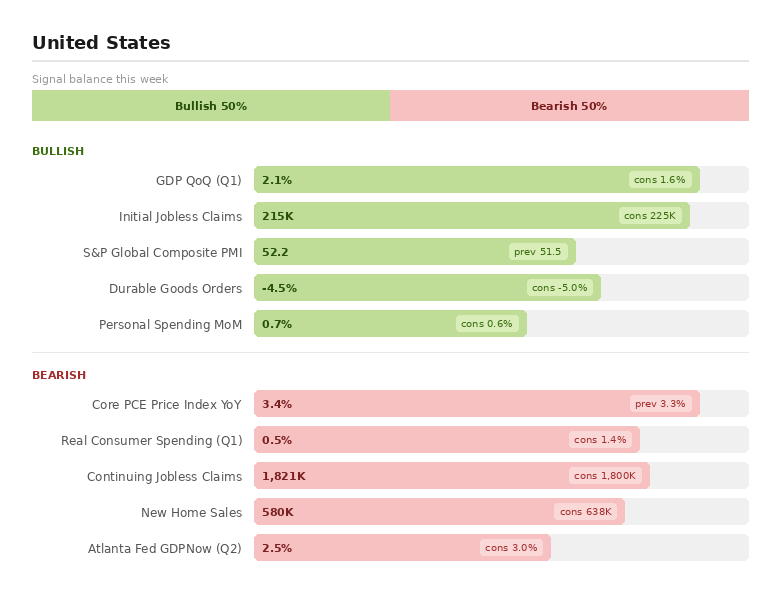
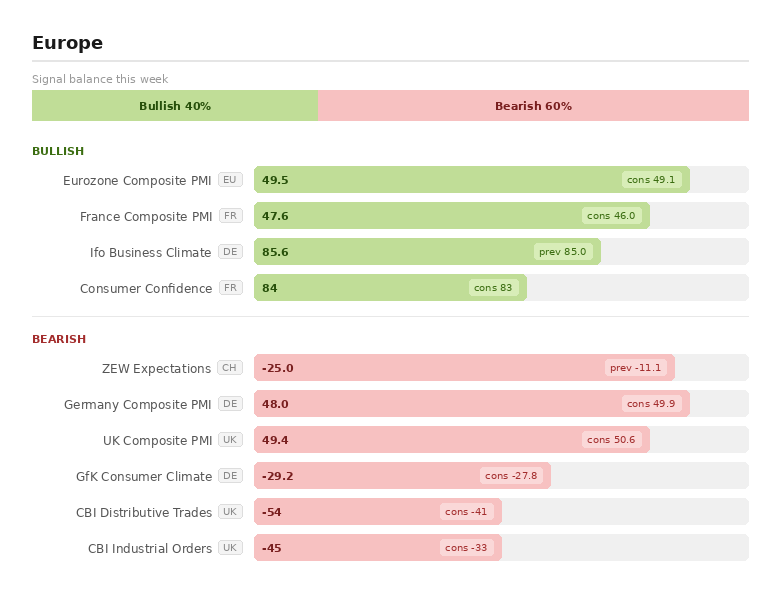
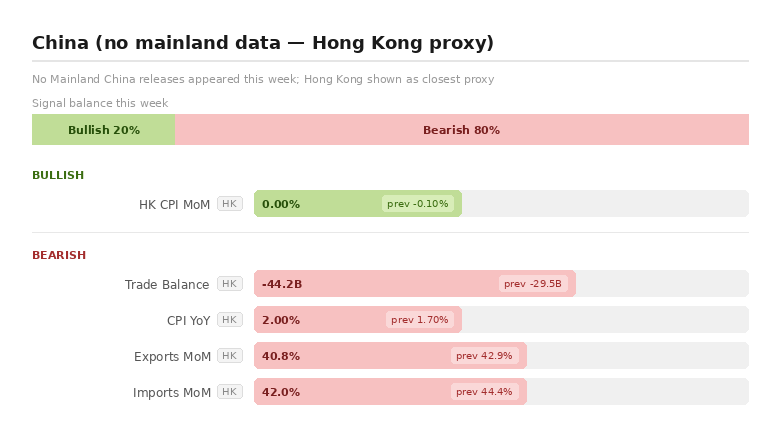
For this week's MST I wanted to dig into where oil is headed from here, and run a read on what traders are actually thinking about the war risk still sitting under this market, because the price action and the curve structure are telling two slightly different stories. Along with that the charts will give the reader a snapshot of important data indicators coming out of US, Europe and China.
Dated Brent is back around $72-75 a barrel, down close to a quarter over the past month, even though the US and Iran were still trading direct strikes on tankers as recently as last week. Brent had touched an intraday peak of $126.41 back in late April, so the round trip from there to here in two months is the real headline.
The clearest evidence the market believes this is actually over sits in the physical loadings data, not the price chart. Saudi Aramco resumed crude loadings at Ras Tanura on June 26, its first cargo out of the terminal since March 8, after nearly four months sitting idle. Two VLCCs were loading on the day, each capable of carrying around 2 million barrels, with a third inbound and a fourth waiting nearby, putting the immediate restart at somewhere between 4 and 8 million barrels re-entering the chain in a single window. That matters because Saudi exports through the Gulf had fallen to about 4 million barrels a day during the war, down from more than 7 million bpd in February, with Aramco rerouting everything through Yanbu on the Red Sea in the meantime. Getting Ras Tanura moving again is the kingdom putting its biggest pipe back into the water, not a symbolic gesture.
Strait-wide, ship-tracking data tells a similar but more cautious story. Tanker-tracking firm Kpler has recorded more than 20 vessels carrying roughly 35 million barrels moving through Hormuz since the reopening agreement, with the busiest single day, June 19, seeing 20 to 25 vessels pass. Spread over the roughly ten days since the agreement, that works out to a rough inferred crude flow of 3 to 4 million barrels a day, a fraction of the strait's pre-war throughput of around 17 to 20 million barrels a day of crude and products. Separately, various vessel tracking based organizations put the seven-day average for inferred crude outflows at above 2 million barrels a day for most of June. Both reads point the same direction: real barrels are moving again, but the strait is running at maybe a fifth of its old pace, even as headline sentiment has already moved on to treating the disruption as resolved.
That gap between the physical recovery and the pricing recovery shows up most clearly in the futures curve. Brent's prompt time-spread has now flipped into a shallow contango, with the front contract trading below the next month out, a structure that typically signals the market expects oversupply rather than scarcity. That's a sharp reversal from earlier in the war, when Brent's prompt spread was deep in backwardation, reflecting a real scramble for barrels that could be delivered immediately rather than in two or three months. Going from backwardation to contango in a matter of weeks is the curve essentially saying the shortage premium is gone, even while actual tanker traffic is still running well below normal.
Positioning data lines up with the curve. Hedge funds had already trimmed Brent net length to a four-month low of around 253,000 contracts in the first week of June, before Ras Tanura had even reopened, which tells you speculative money was fading the war ahead of the physical evidence catching up to it.
Put together, the market has priced a fuller recovery than the tanker data currently supports. That's not necessarily wrong, momentum in these things tends to build once it starts, but it does mean there's very little cushion left if Doha talks stumble or another incident flares up near the strait. Worth watching whether Hormuz transit volumes keep climbing through July, because that's the number that will actually confirm or break the story the curve is already telling.
Upgrade to Pro Today and get…
• This article — plus dozens more each month, all within our full Research Module
• Frac Hits — our National-Level Frac Spread Count and Frac Job Count, updated weekly
• Frac Operator Monitor — detailed FSC & FJC by operator
• And so much more, designed to help you track, forecast, and outperform