

Articles
- BLOG / Articles / View
- Articles
Monday Macro View: How did Frac Utilization rate predict U.S. record production in 2025?
By Osama on May 18, 2026 in Market Sentiment
The EIA recently confirmed that U.S. total energy production reached 107 quadrillion BTUs in 2025, a 3.4% increase over 2024 and the fourth consecutive annual record. Crude oil production rose to 13.6 million barrels per day, dry natural gas hit 39 trillion cubic feet, and natural gas plant liquids grew 7% to a record 4 trillion cubic feet. The Permian, Appalachia, and Haynesville regions accounted for most of the growth. These are significant numbers, and they raise a reasonable question: what did the completions side of the industry look like while this production was being delivered? But before that let's talk about the recent FSC an FJC numbers.
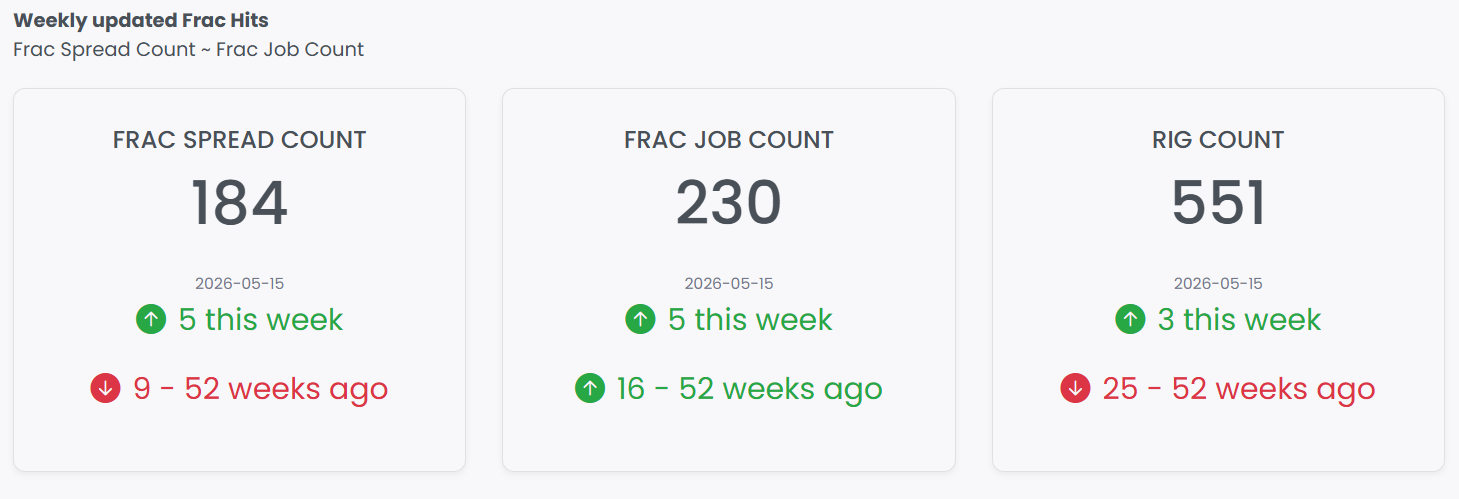
FSC and FJC continues the upward momentum with the former increasing by 5 (for the third consecutive week) now standing at 184 and the later showing strong gains and is infact 16 counts higher than where it was last year.
Now coming back to the US energy production question and its connection with completions.
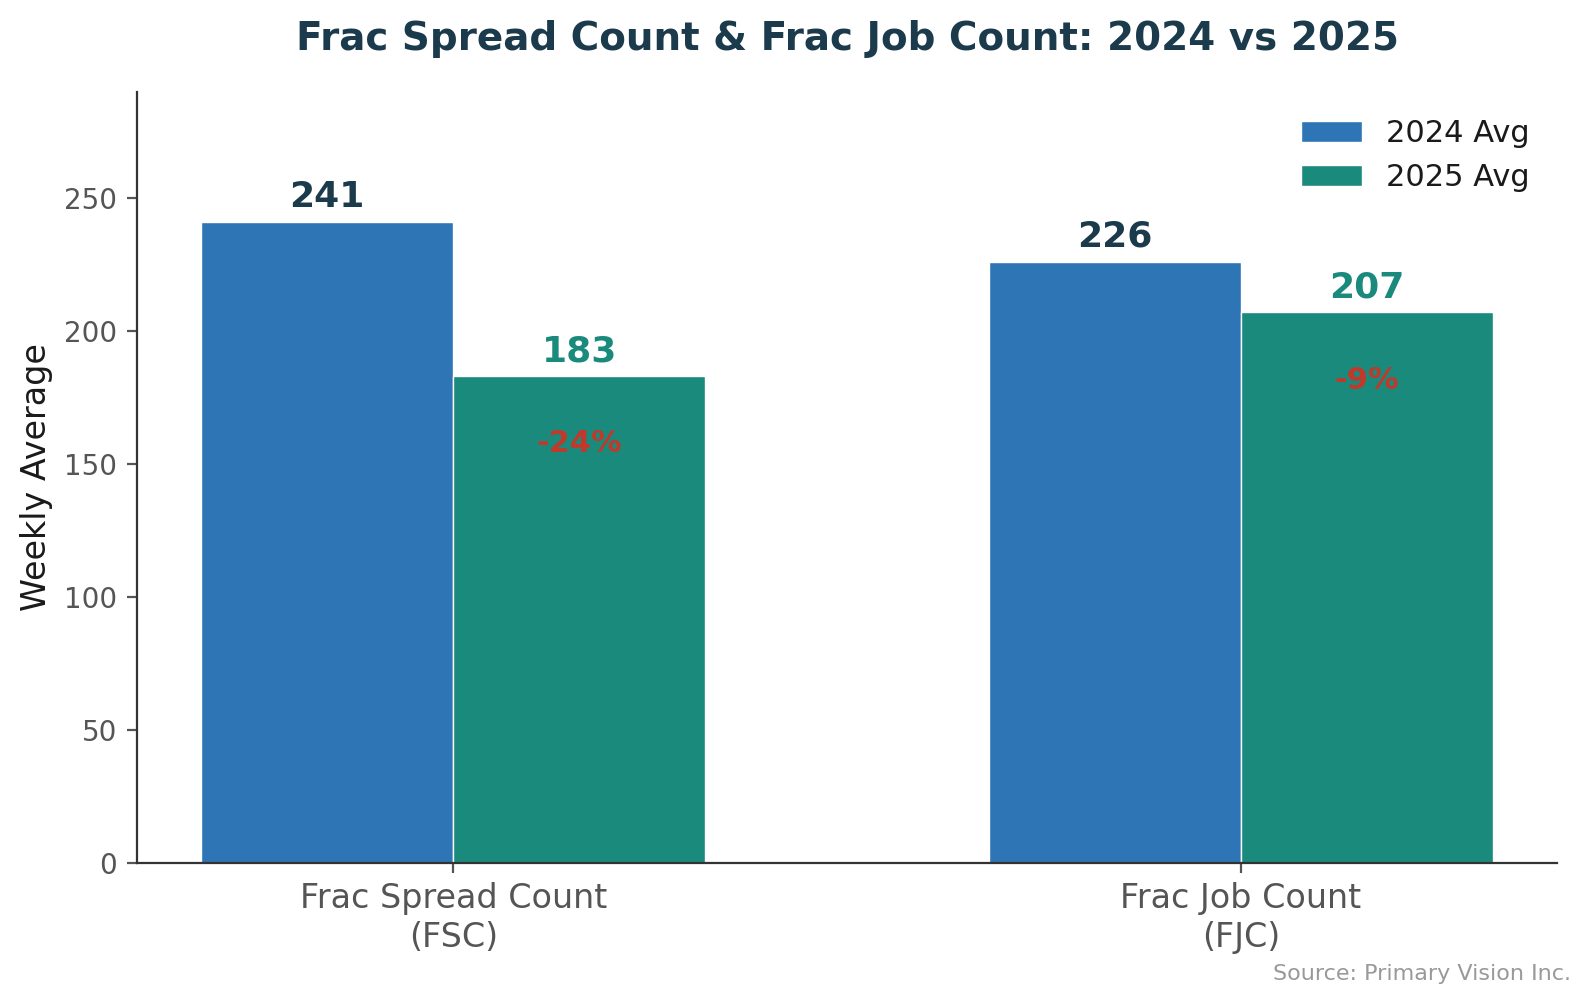
Primary Vision's data offers a direct answer. The average weekly Frac Spread Count in 2024 was 241. In 2025, it fell to 183, a decline of 24%. The average Frac Job Count moved from 226 to 207, a decline of 9%. Production rose to record levels while the number of active frac spreads and the volume of frac jobs both fell. The relationship between completions activity and production output has shifted, and that shift is measurable.
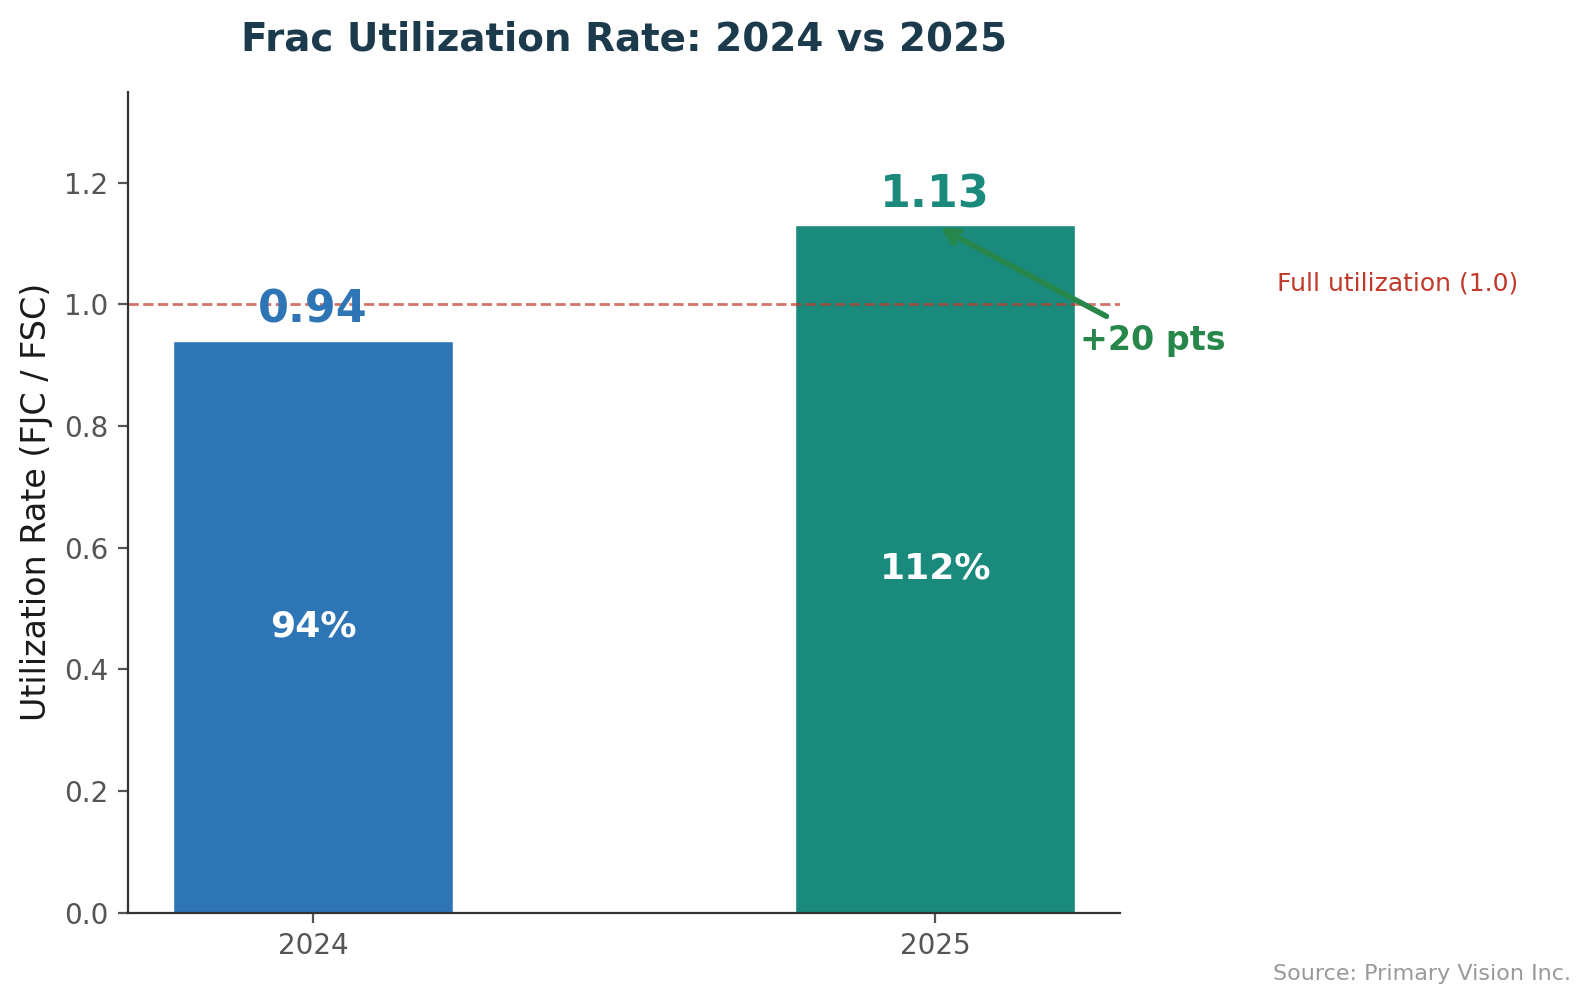
One way to quantify it is through the Frac Utilization Rate, defined as the ratio of Frac Job Count to Frac Spread Count. In 2024, this ratio stood at 0.94, indicating that the number of deployed spreads exceeded the number of active jobs on a weekly average basis. By 2025, it had risen to 1.13, a 20 percentage point increase. Each active spread was cycling through more jobs than in the prior year, a pattern consistent with longer laterals, higher stage counts per well, and more efficient scheduling of completion operations. The fact that FJC declined by only 9% while FSC dropped by 24% confirms that the remaining spreads absorbed a disproportionate share of activity.
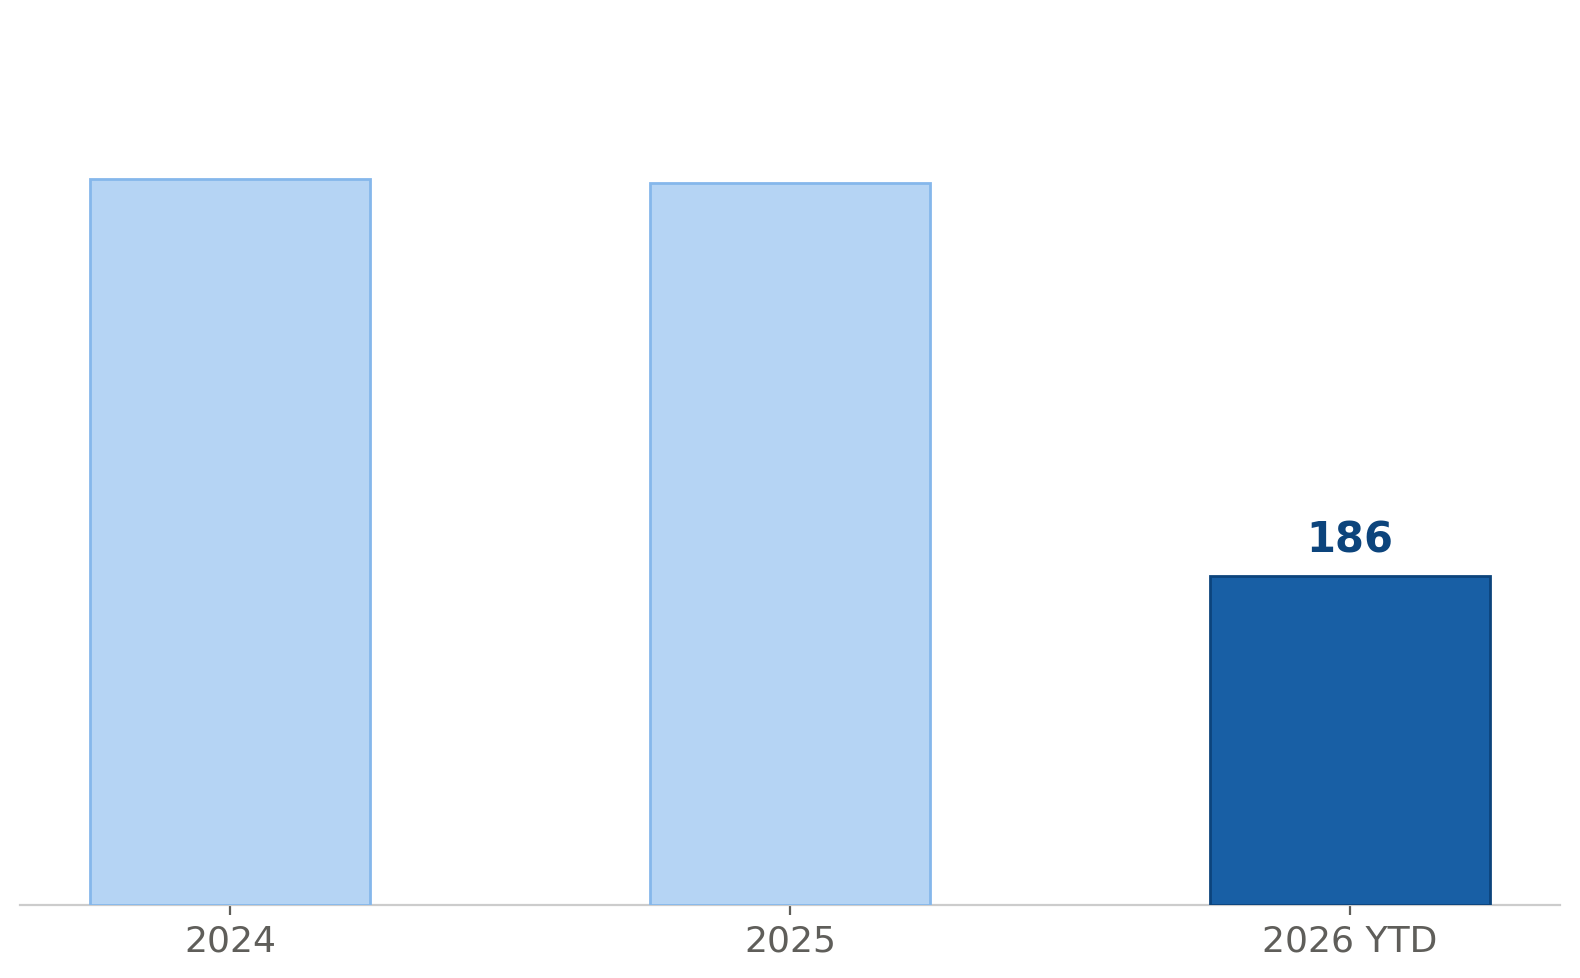
The consolidation extends beyond equipment to the operators themselves. Primary Vision's operator-level tracking shows the field held relatively steady over the past couple of years, with the operator count largely flat heading into 2026. This year, however, that number has collapsed to just 186 operators year-to-date, a drop of more than half from the prior year. Even adjusting for partial-year data, the contraction is striking and points to a sharp wave of exits or idling among smaller operators as market conditions tighten.
This pattern is consistent with broader industry analysis. An EY study published in August 2025 found that M&A activity had reduced the number of top publicly traded U.S. E&P companies from 50 to 40, driven by $206.6 billion in deal value in 2024 alone — a 331% increase over 2023. According to a Kavout analysis from April 2026, roughly 70% of U.S. shale acreage is now operated by large public companies. Recent transactions reinforce the trend: SM Energy's approximately $13 billion merger with Civitas Resources, Crescent Energy's $3 billion acquisition of Vital Energy, and Antero Resources' $2.8 billion purchase of HG Energy's Marcellus assets all point toward a smaller number of operators holding larger, more concentrated acreage positions. Primary Vision's completions data reflects the downstream effect of this consolidation — fewer companies are executing more frac jobs using fewer spreads, therefore, despite falling rig count, aggregate output continues to rise.
Primary Vision's NGL Supply Volume data adds a further layer. NGL supply has grown from approximately 2,500 units in 2010 to over 8,000 by late 2025, tracking closely with the EIA's reported record of 4 trillion cubic feet. Primary Vision's forecasting model projects NGL supply volume reaching approximately 8,500 by mid-2026 before moderating toward 8,200 by January 2027. This forward-looking dimension complements the EIA's retrospective annual reporting and provides additional context on the trajectory of liquids-rich production tied to completions activity.
The EIA data establishes what the U.S. produced in 2025. Primary Vision's data — Frac Spread Count, Frac Job Count, Frac Utilization Rate, operator-level tracking, and NGL supply monitoring — provides the operational detail behind that production. Taken together, they describe an industry producing more output with fewer participants, fewer spreads, and higher per-unit intensity across the completion cycle.
Tags:
Permission denied
Upgrade to Pro Today and get…
• This article — plus dozens more each month, all within our full Research Module
• Frac Hits — our National-Level Frac Spread Count and Frac Job Count, updated weekly
• Frac Operator Monitor — detailed FSC & FJC by operator
• And so much more, designed to help you track, forecast, and outperform


