Monday Macro View: Is the Frac Count Recovery Hiding More Than It's Revealing?
By
Osama
on June 29, 2026
in
Market Sentiment
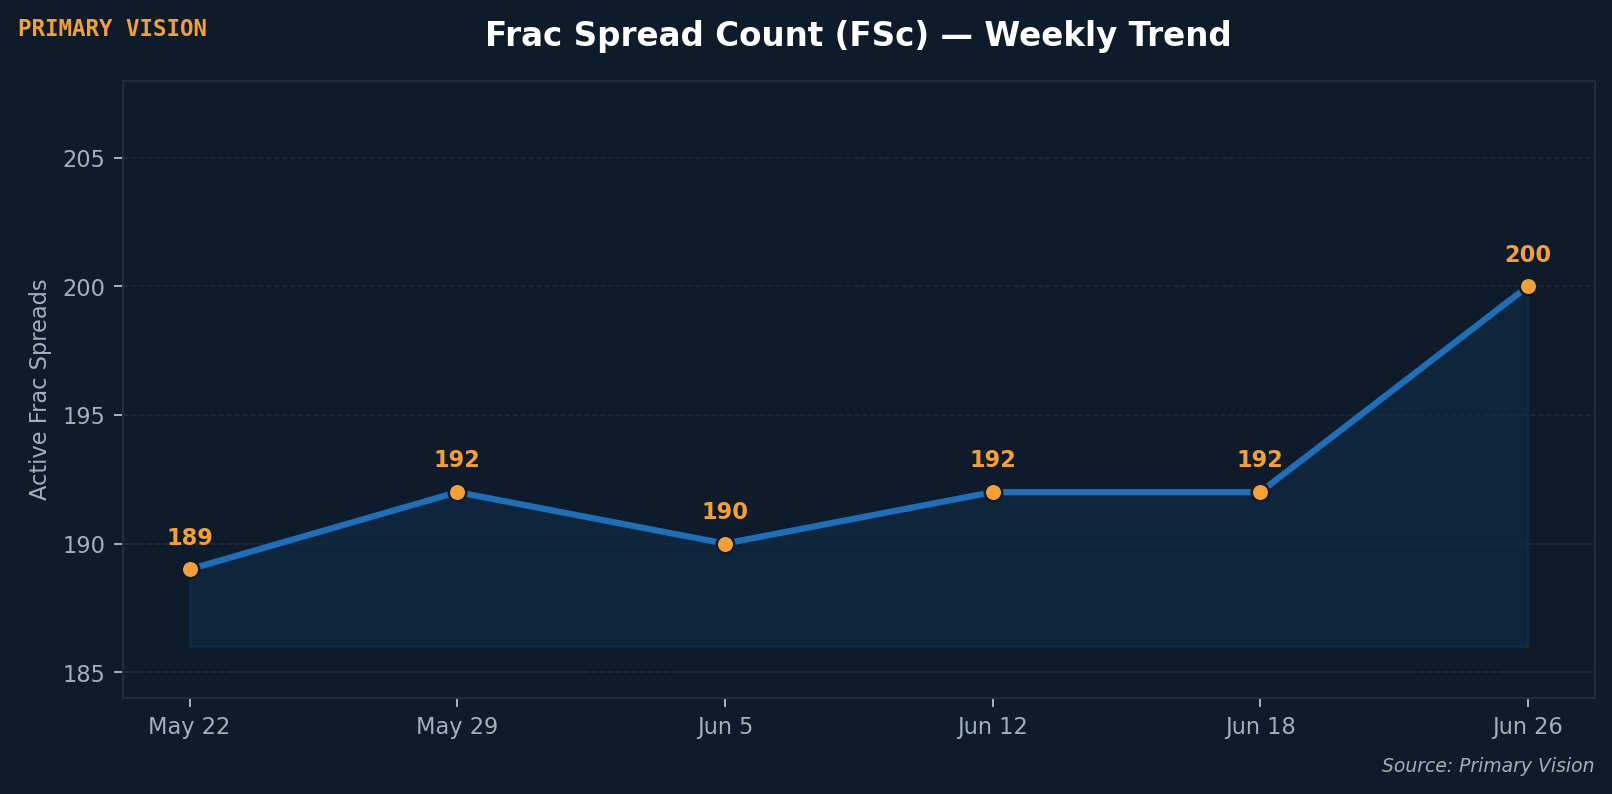
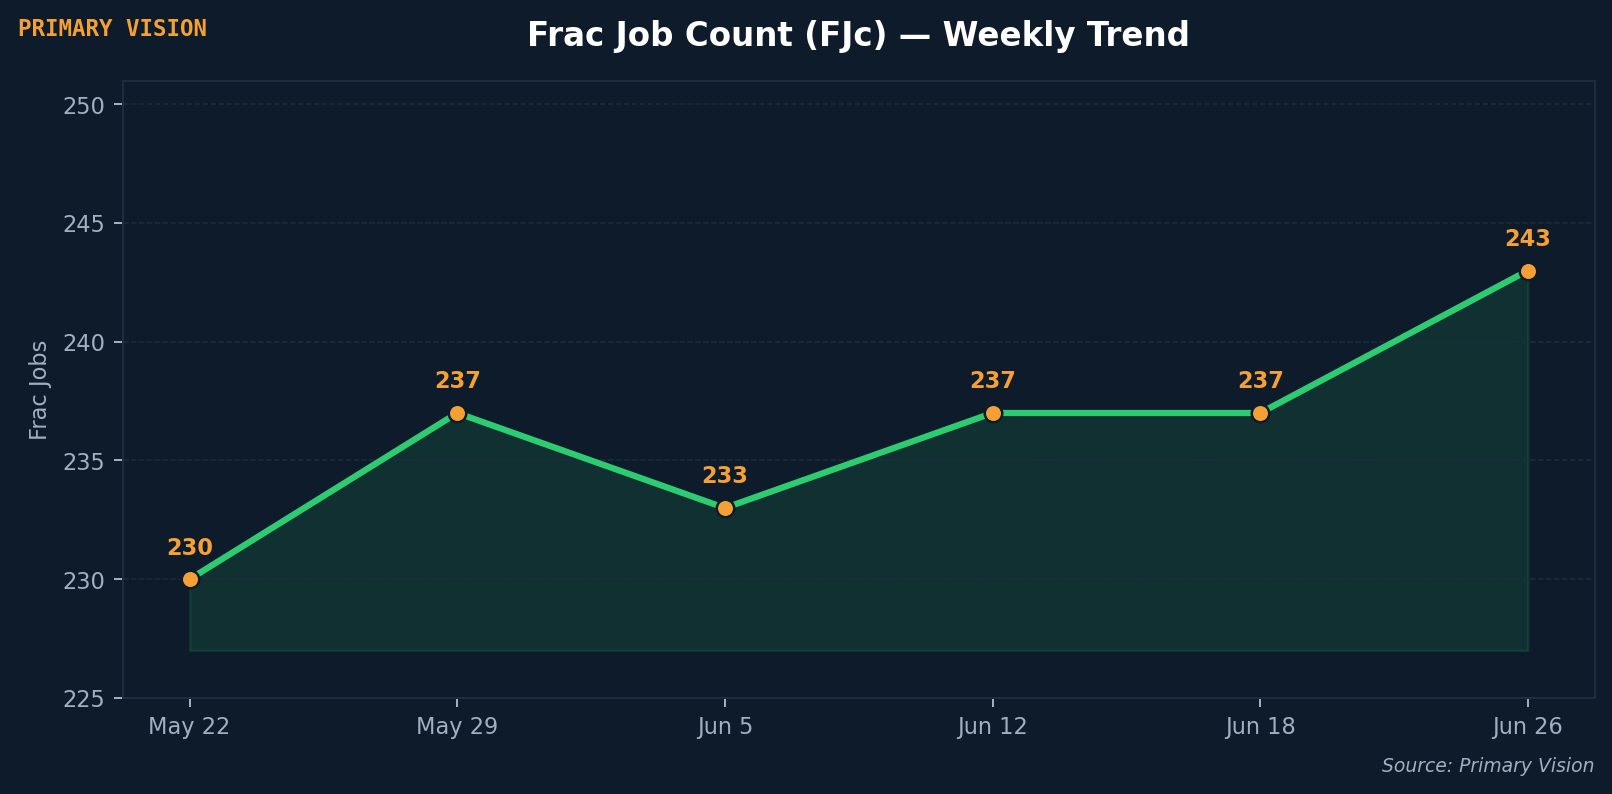
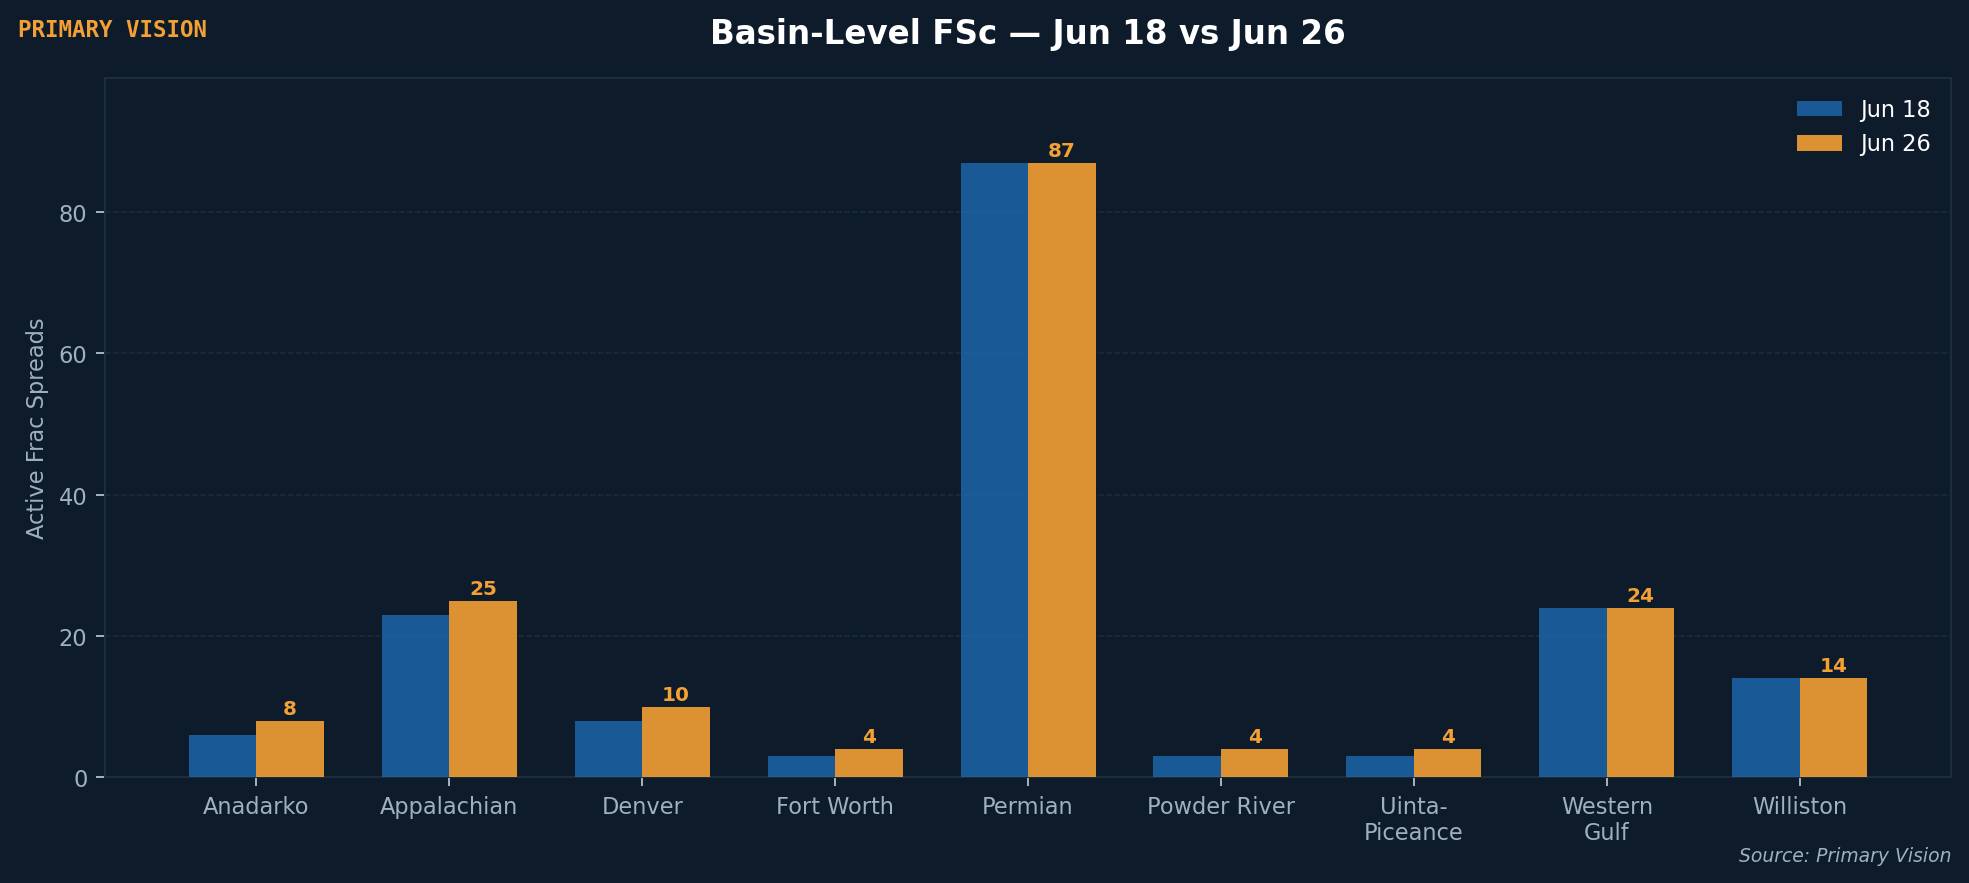
Primary Vision's latest weekly data show the Frac Spread Count (FSC) rising from 192 to 200 for the week ending June 26, while the Frac Job Count (FJC) moved from 237 to 243 over the same period. Both metrics are moving in the right direction. What stands out is where the FSC growth came from — the Permian, the largest oil-directed basin in the count, was flat week-on-week, suggesting the eight-spread gain was driven by gas-leaning and mixed basins.
At $71–73 WTI heading into the back half, Permian operators like Permian Resources reported Q1 2026 realized oil prices of $70.91/bbl while squeezing drilling and completion costs down to approximately $685 per lateral foot, pointing to a basin running on efficiency discipline, something that we've pointing for many years. The FJC move from 237 to 243 is perhaps the more important signal of the two — it suggests actual completions are keeping pace with active spreads, which matters because a rising FSC with stagnant FJC would indicate crews mobilizing but not yet pulling the trigger. That both are moving together is constructive, even if the composition of this week's gain suggests the oil-directed recovery remains tentative at these price levels. Whether gas-basin momentum can continue to carry the headline count higher into July, without a meaningful contribution from oil-weighted plays, is the question worth tracking in the weeks ahead.
Now turning towards the markets, we see some extraordinary position. Global oil markets remain deeply volatile as the de facto closure of the Strait of Hormuz surpassed three months, with Brent averaging $107/b in May before falling as the United States and Iran neared a ceasefire agreement. Since then diplomacy has moved fast, with WTI falling approximately around $73/bbl and Brent to near $77/bbl following a U.S.-Iran memorandum of understanding, with WTI sitting around $71.50 as of June 26. The IEA has dramatically revised its demand outlook, now forecasting global oil demand will decrease by 1.1 million b/d in 2026, against expectations for growth of 0.2 million b/d just a month prior, as elevated prices destroyed demand across Asia. For U.S. shale producers the collapse from the April peak is more immediately relevant than the geopolitical drama — at these price levels, economics in oil-weighted basins are increasingly challenged and capital discipline is likely to remain the default posture heading into Q3.
What the broader physical market is telling us may be more instructive than the flat price alone. U.S. commercial crude inventories fell by 6.1 million barrels to 412.1 million barrels for the week ending June 19, now 7% below the five-year average, while refineries operated at 96.1% capacity processing 17.1 million b/d. That is a striking combination — crude stocks drawing sharply even as the forward curve sits in contango, and refineries running near flat-out even as the flat price collapses toward pre-conflict levels. Distillate inventories remain 10% below the five-year average despite a 3.1 million barrel build last week, suggesting product tightness is not yet resolved. The crack spread illustrate this dynamic clearly — refinery margins have surged back toward recent highs even as crude timespreads have flipped into contango, a combination that has no precedent in prior cycles going back to 2008.
Taken together with the FSC and FJC uptick this week, the physical data points to a market that is tighter than the futures curve implies — crude is drawing, refiners are running hard, products remain below seasonal norms, and completion activity is nudging higher. Whether that tightness proves durable depends almost entirely on how quickly Hormuz normalizes and whether the demand destruction from four months of $100+ oil proves sticky into the second half. Those are the two variables worth watching closely in the weeks ahead.
Upgrade to Pro Today and get…
• This article — plus dozens more each month, all within our full Research Module
• Frac Hits — our National-Level Frac Spread Count and Frac Job Count, updated weekly
• Frac Operator Monitor — detailed FSC & FJC by operator
• And so much more, designed to help you track, forecast, and outperform