






Articles
- BLOG / Articles / View
- Articles
Monday Macro View: Is the U.S. Frac Market Still Following Its Seasonal Playbook?
By Osama on November 2, 2026 in Market Sentiment
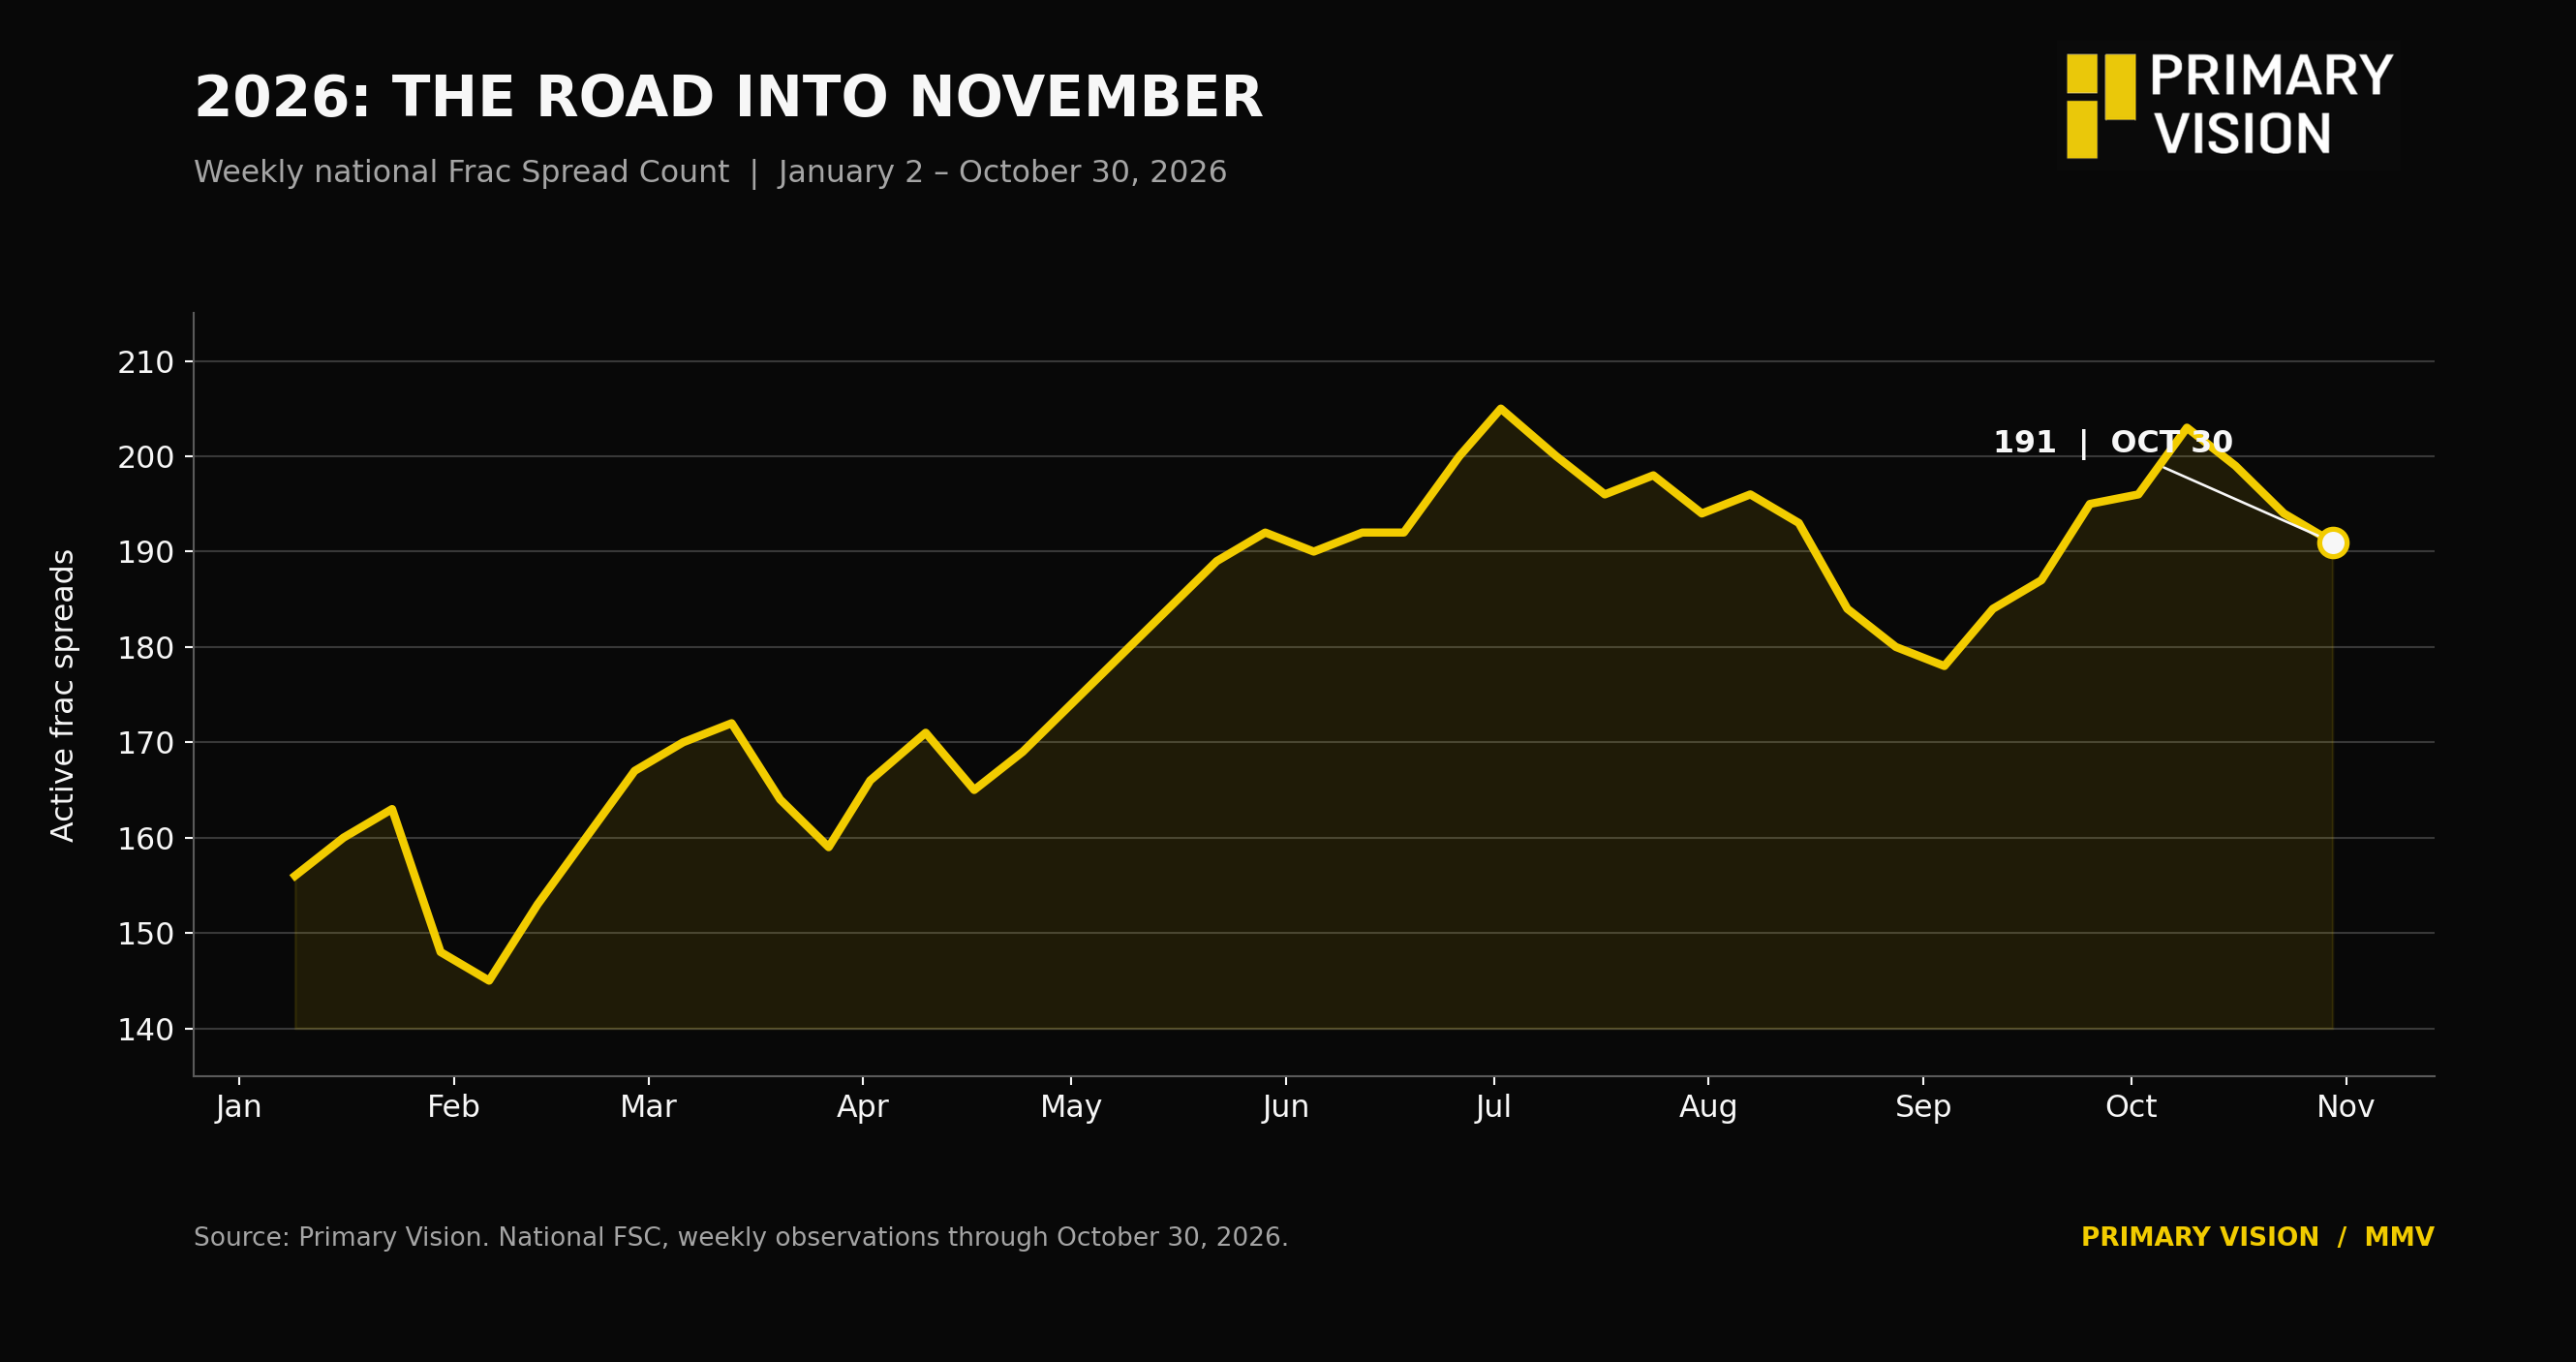
The latest Frac Spread Count touched 191 declining by 3 on a WoW basis and the Frac Job Count followed the pattern falling by 3 settling at 235. However, in this MMV, I wanted to discuss something new. Every year, as we approach November, conversations across the U.S. oilfield begin to change. Operators start looking at what remains of their capital budgets, service companies think about equipment utilization heading into winter, and attention gradually turns towards the following year's drilling and completion programs.
It's also around this time that frac activity tends to lose momentum.
We've seen something similar over the past three weeks. Primary Vision's Frac Spread Count™ (FSC) reached 203 on October 9 before declining to 191 by October 30. That is a reduction of nearly 6% in less than a month. With November underway and 2027 approaching, I thought it would be worth looking at how the industry has historically behaved during this period.
We went through 670 weekly FSC observations dating back to January 2014, covering some of the most turbulent years in the history of American shale. The objective was to identify recurring patterns, understand whether they have changed, and see what those changes might tell us about the market today.
The results were quite revealing.
In 11 of the 12 completed years between 2014 and 2025, average frac activity in December was lower than in October. The only exception was 2020, when the industry was recovering from the extraordinary collapse triggered by the pandemic.
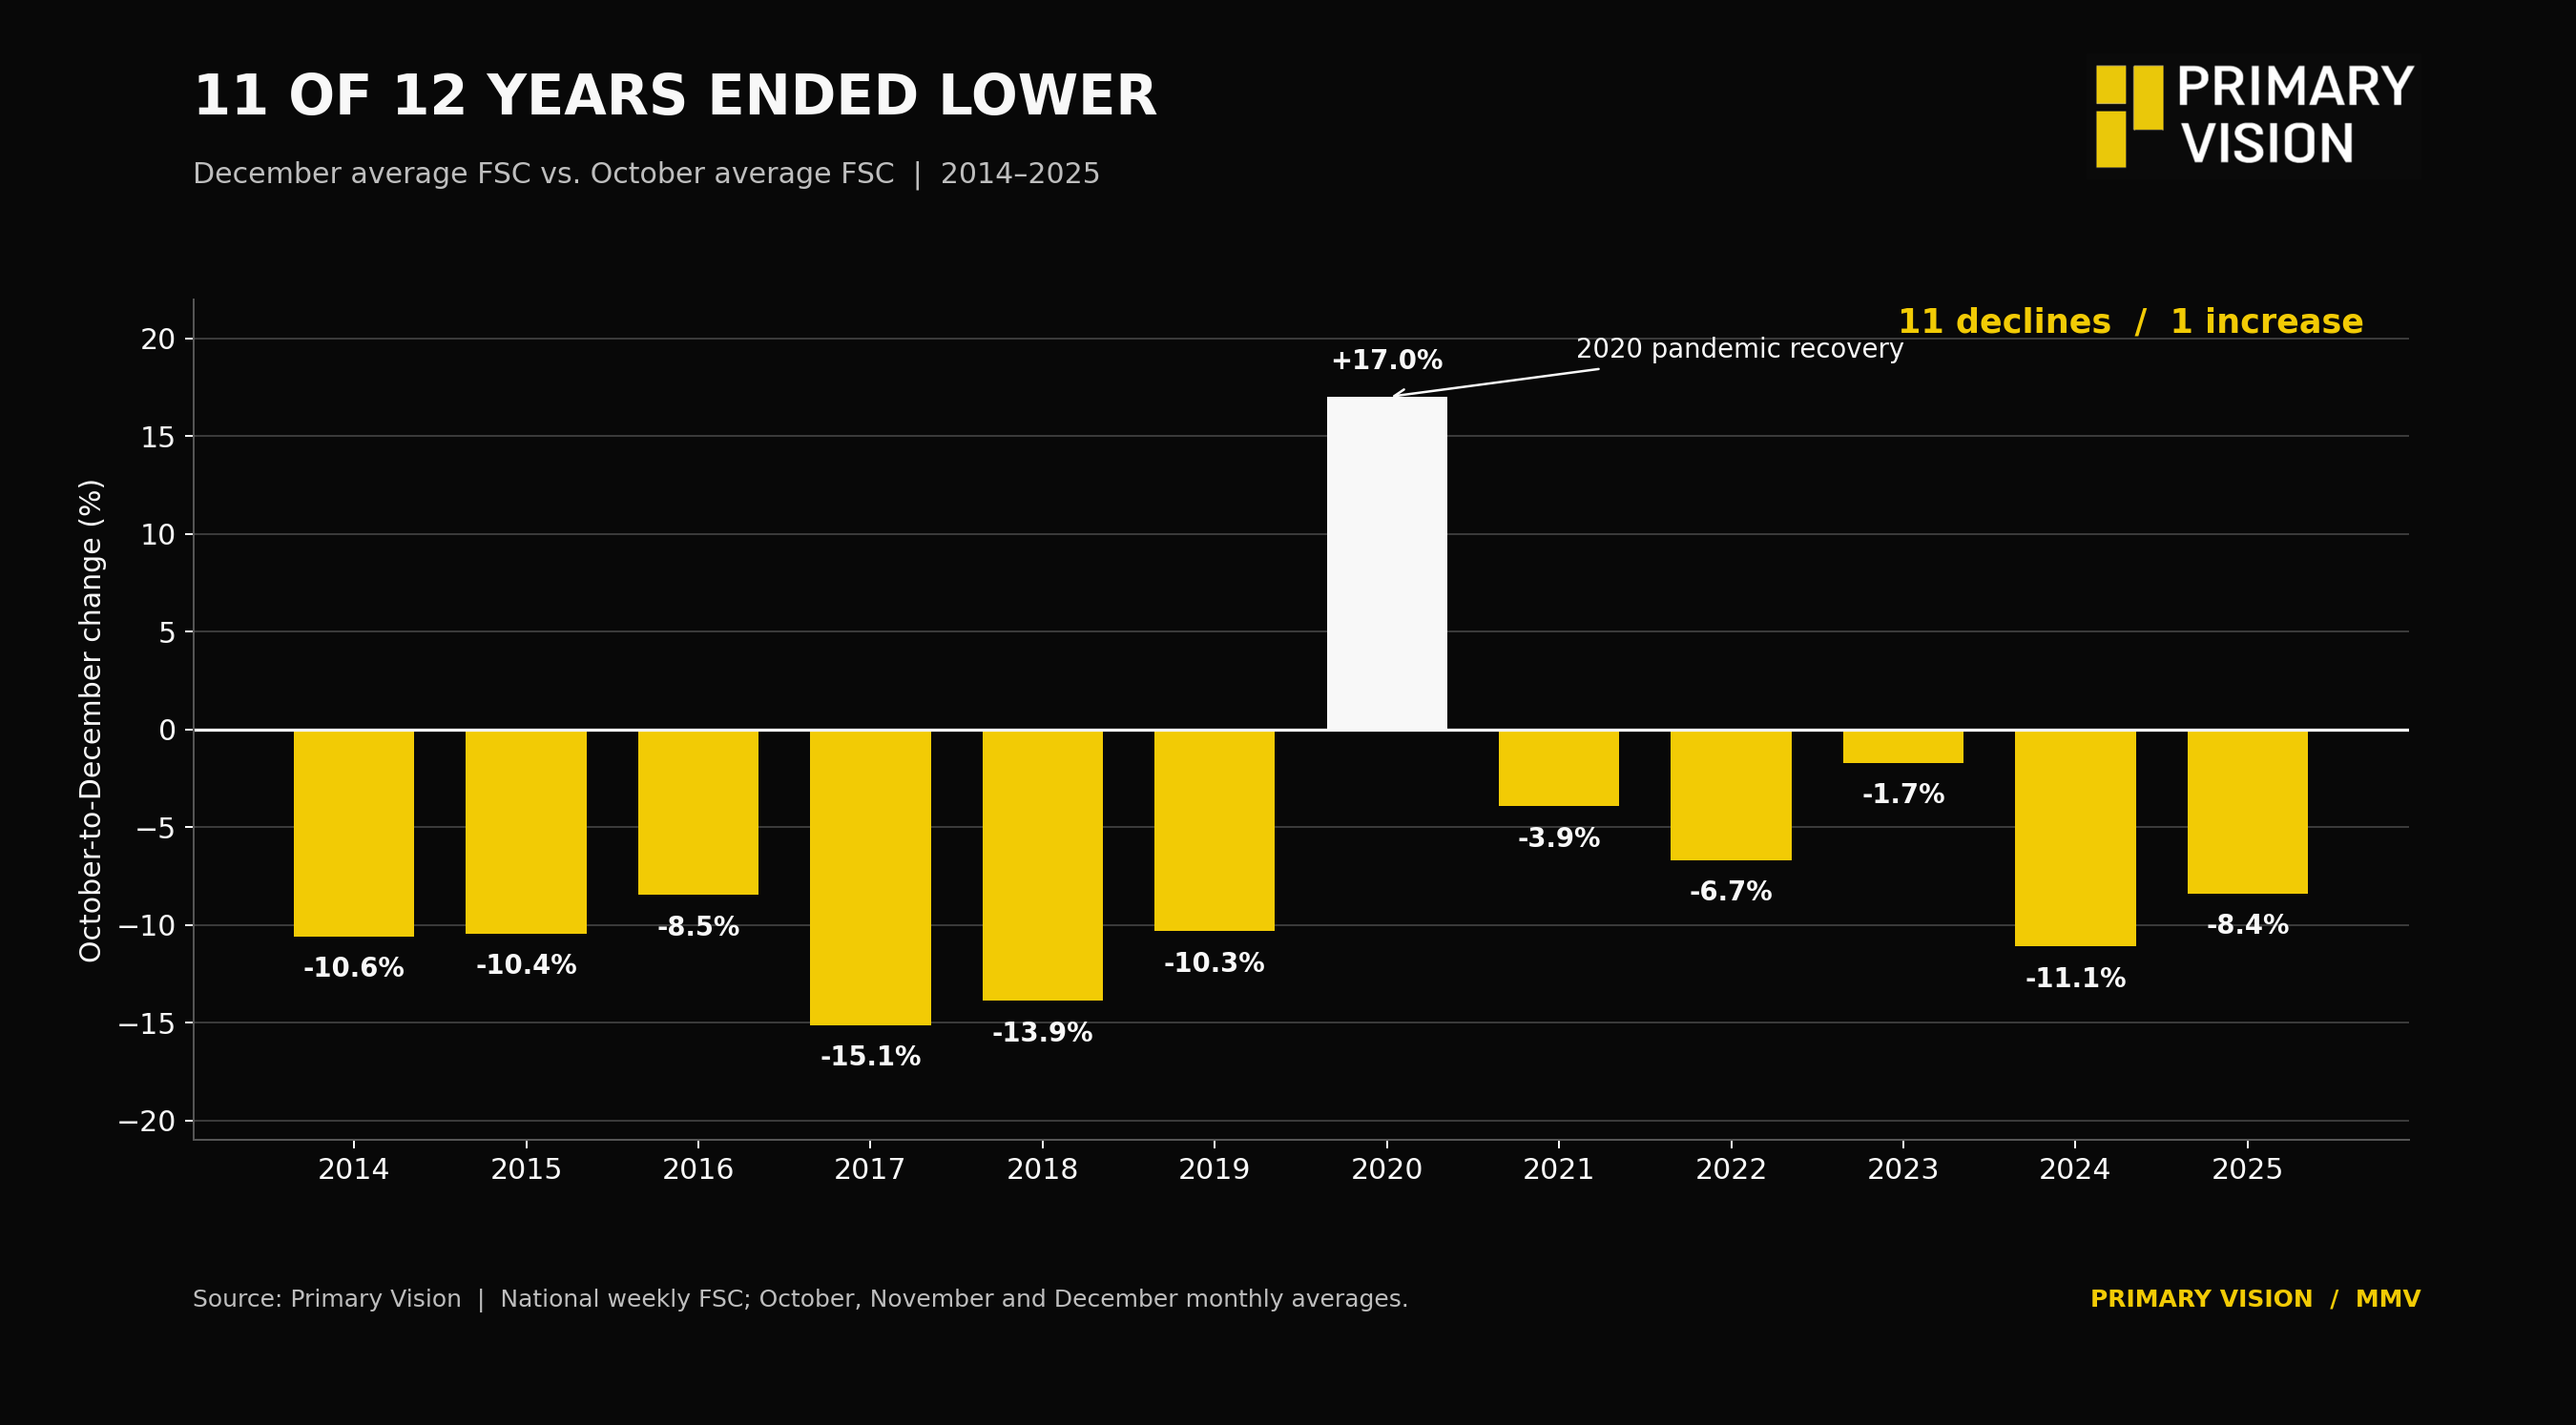
Consider what happened during those twelve years. Oil prices collapsed in 2014–2016, the industry recovered during 2017–2018, capital discipline became a central theme in subsequent years, and then came COVID-19. The recovery that followed was accompanied by another sharp increase in commodity prices after Russia invaded Ukraine.
Despite these vastly different market conditions, the year-end decline appeared almost every time.
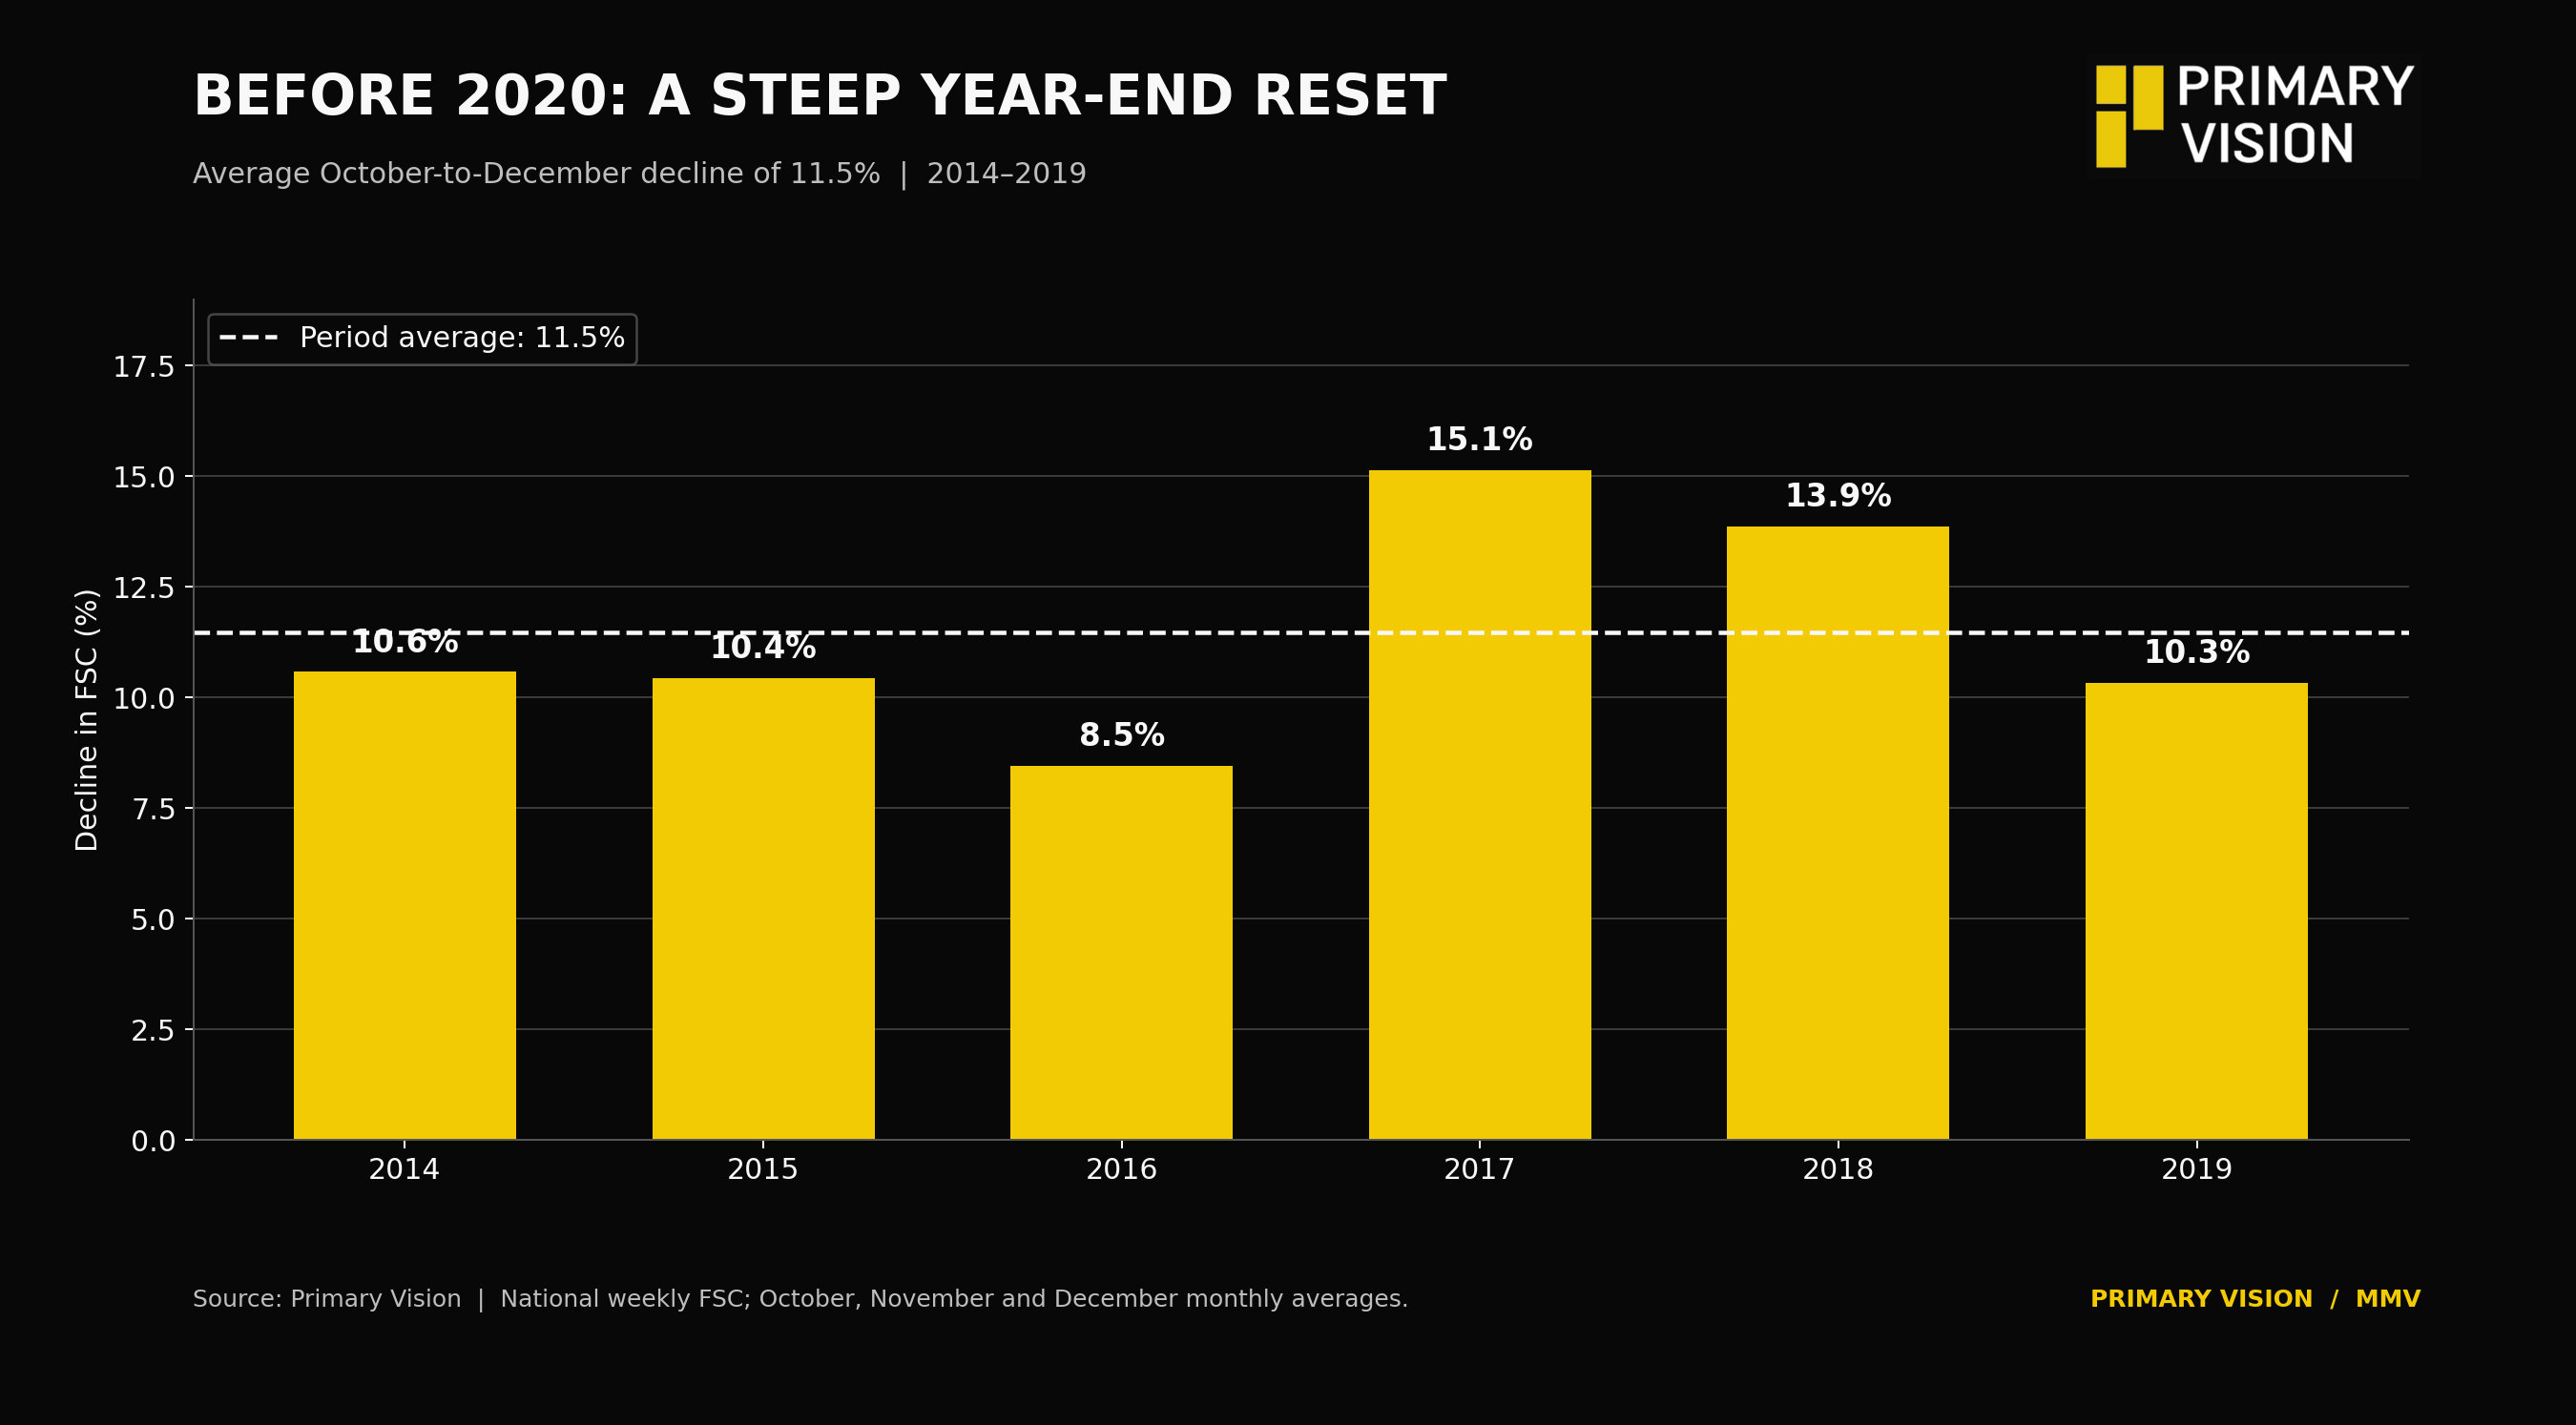
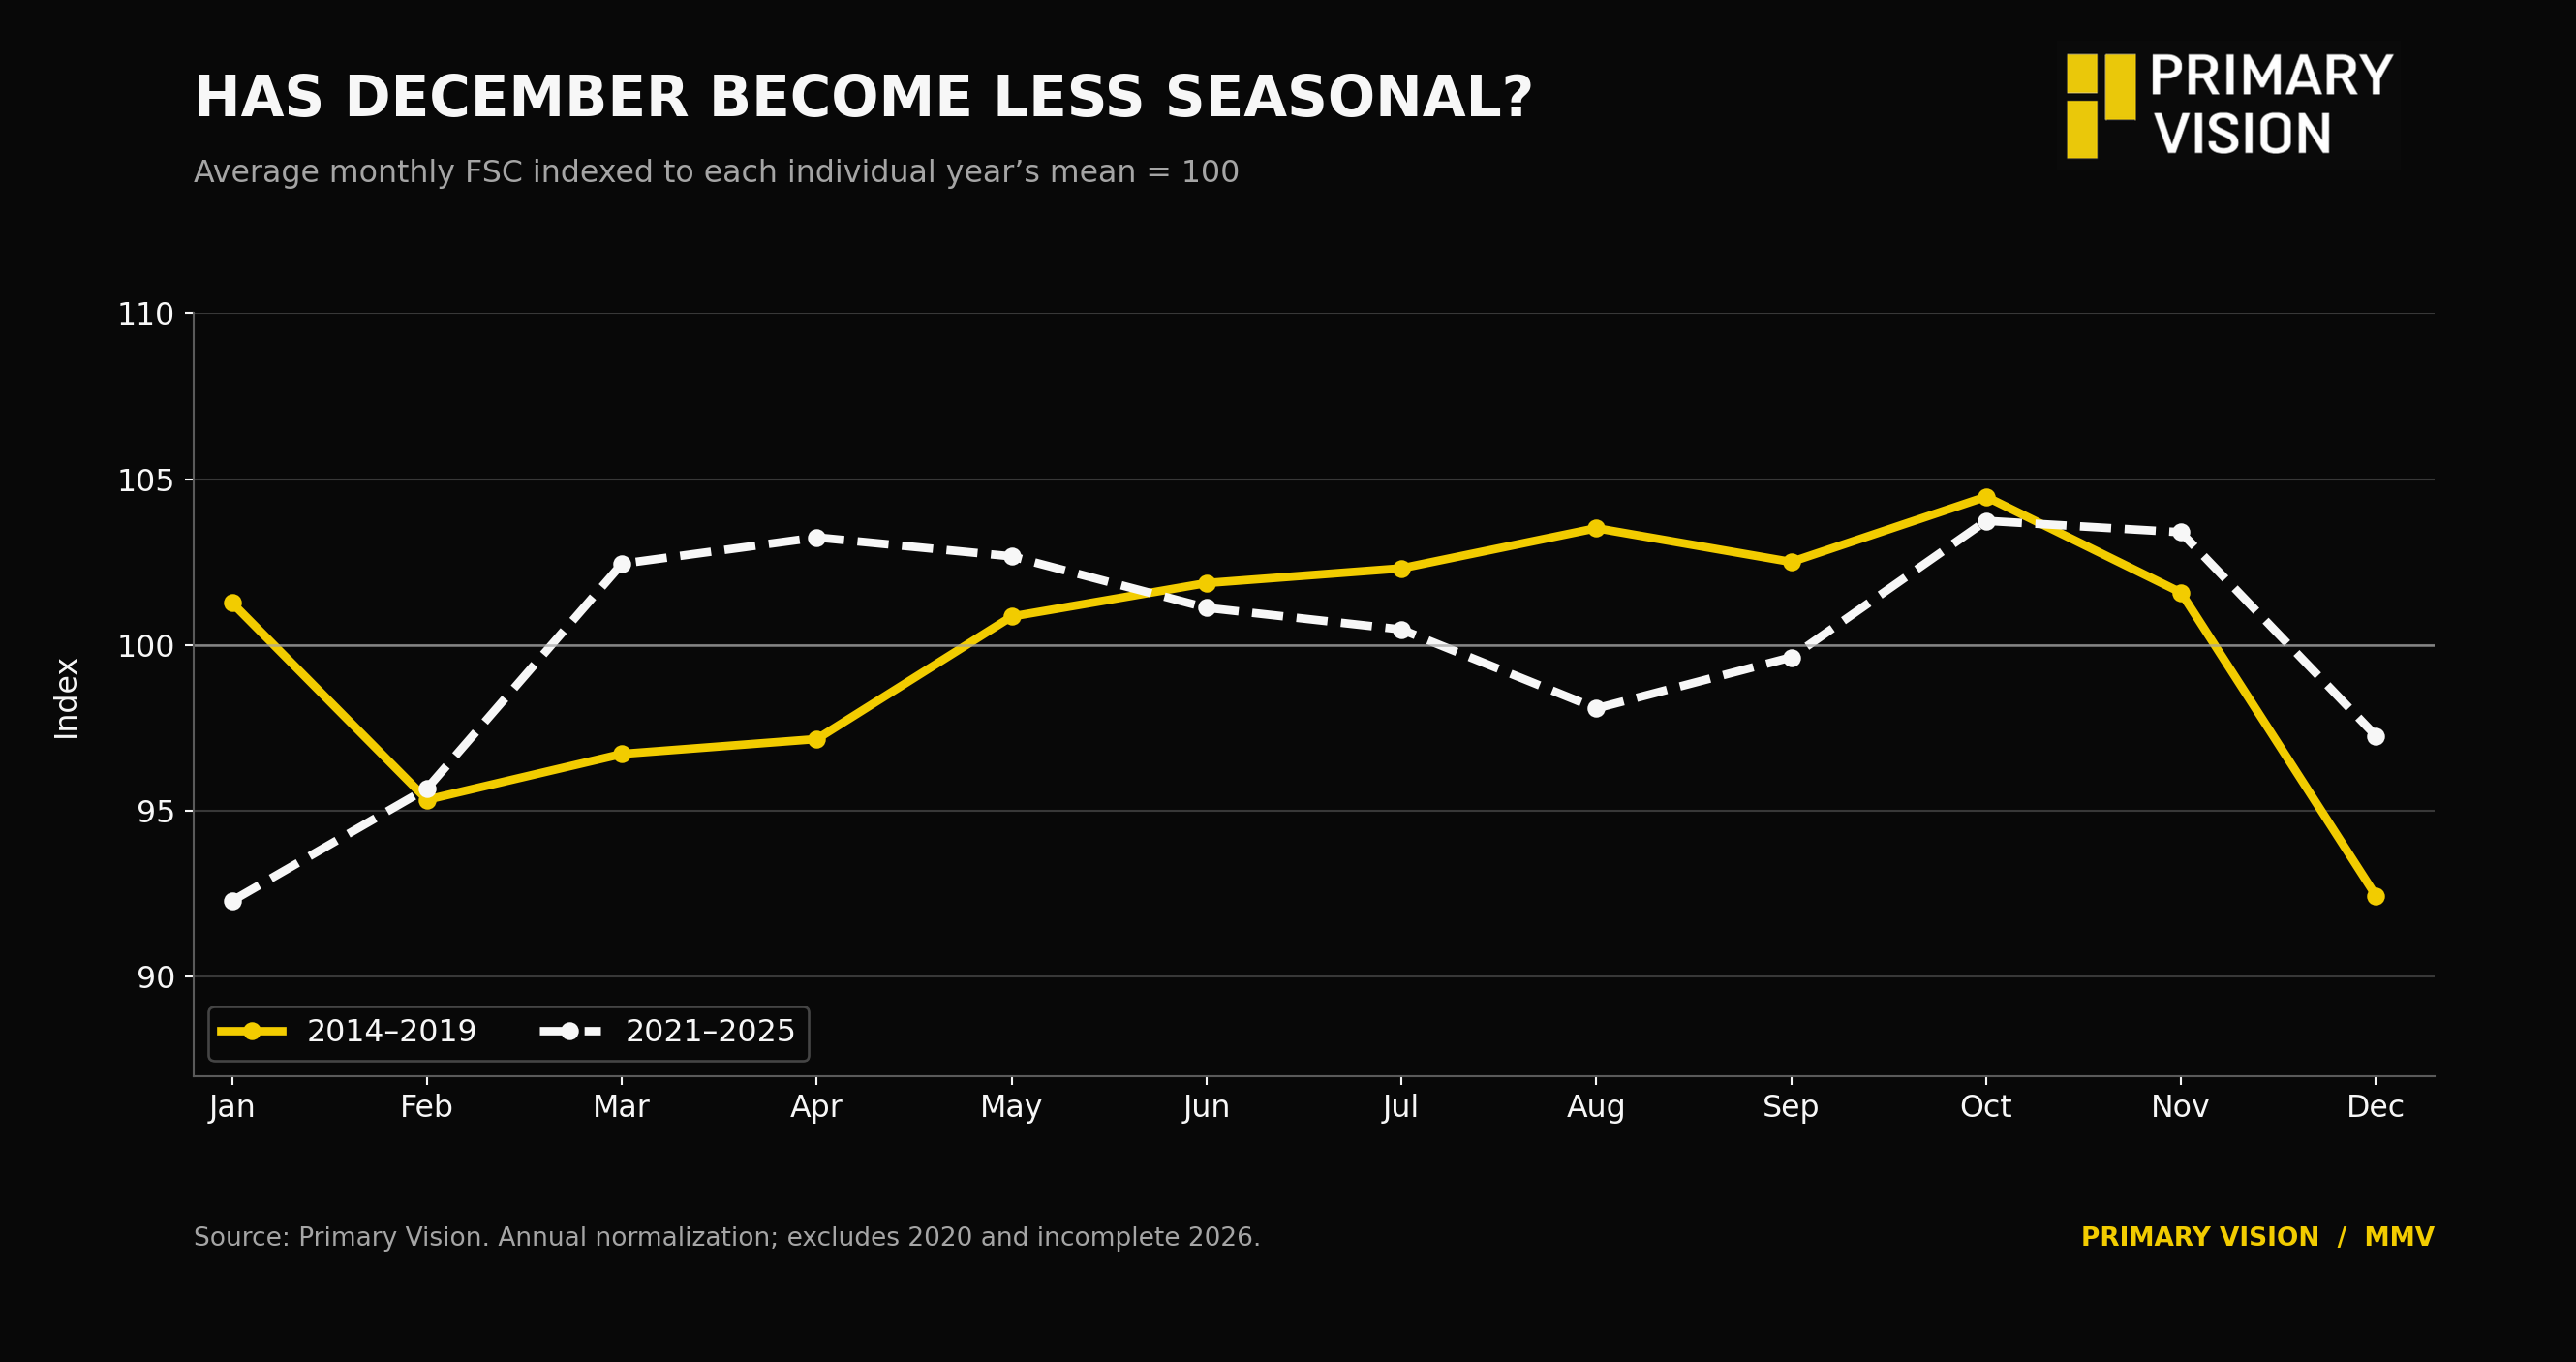
Between 2014 and 2019, the average reduction from October to December was approximately 11.5%. In 2017, it reached 15.1%, while 2018 recorded a 13.9% decline. Even in 2014, when the industry was operating at a considerably larger scale, activity fell 10.6%. What's interesting is that the industry has changed substantially since then, but the pattern has survived.
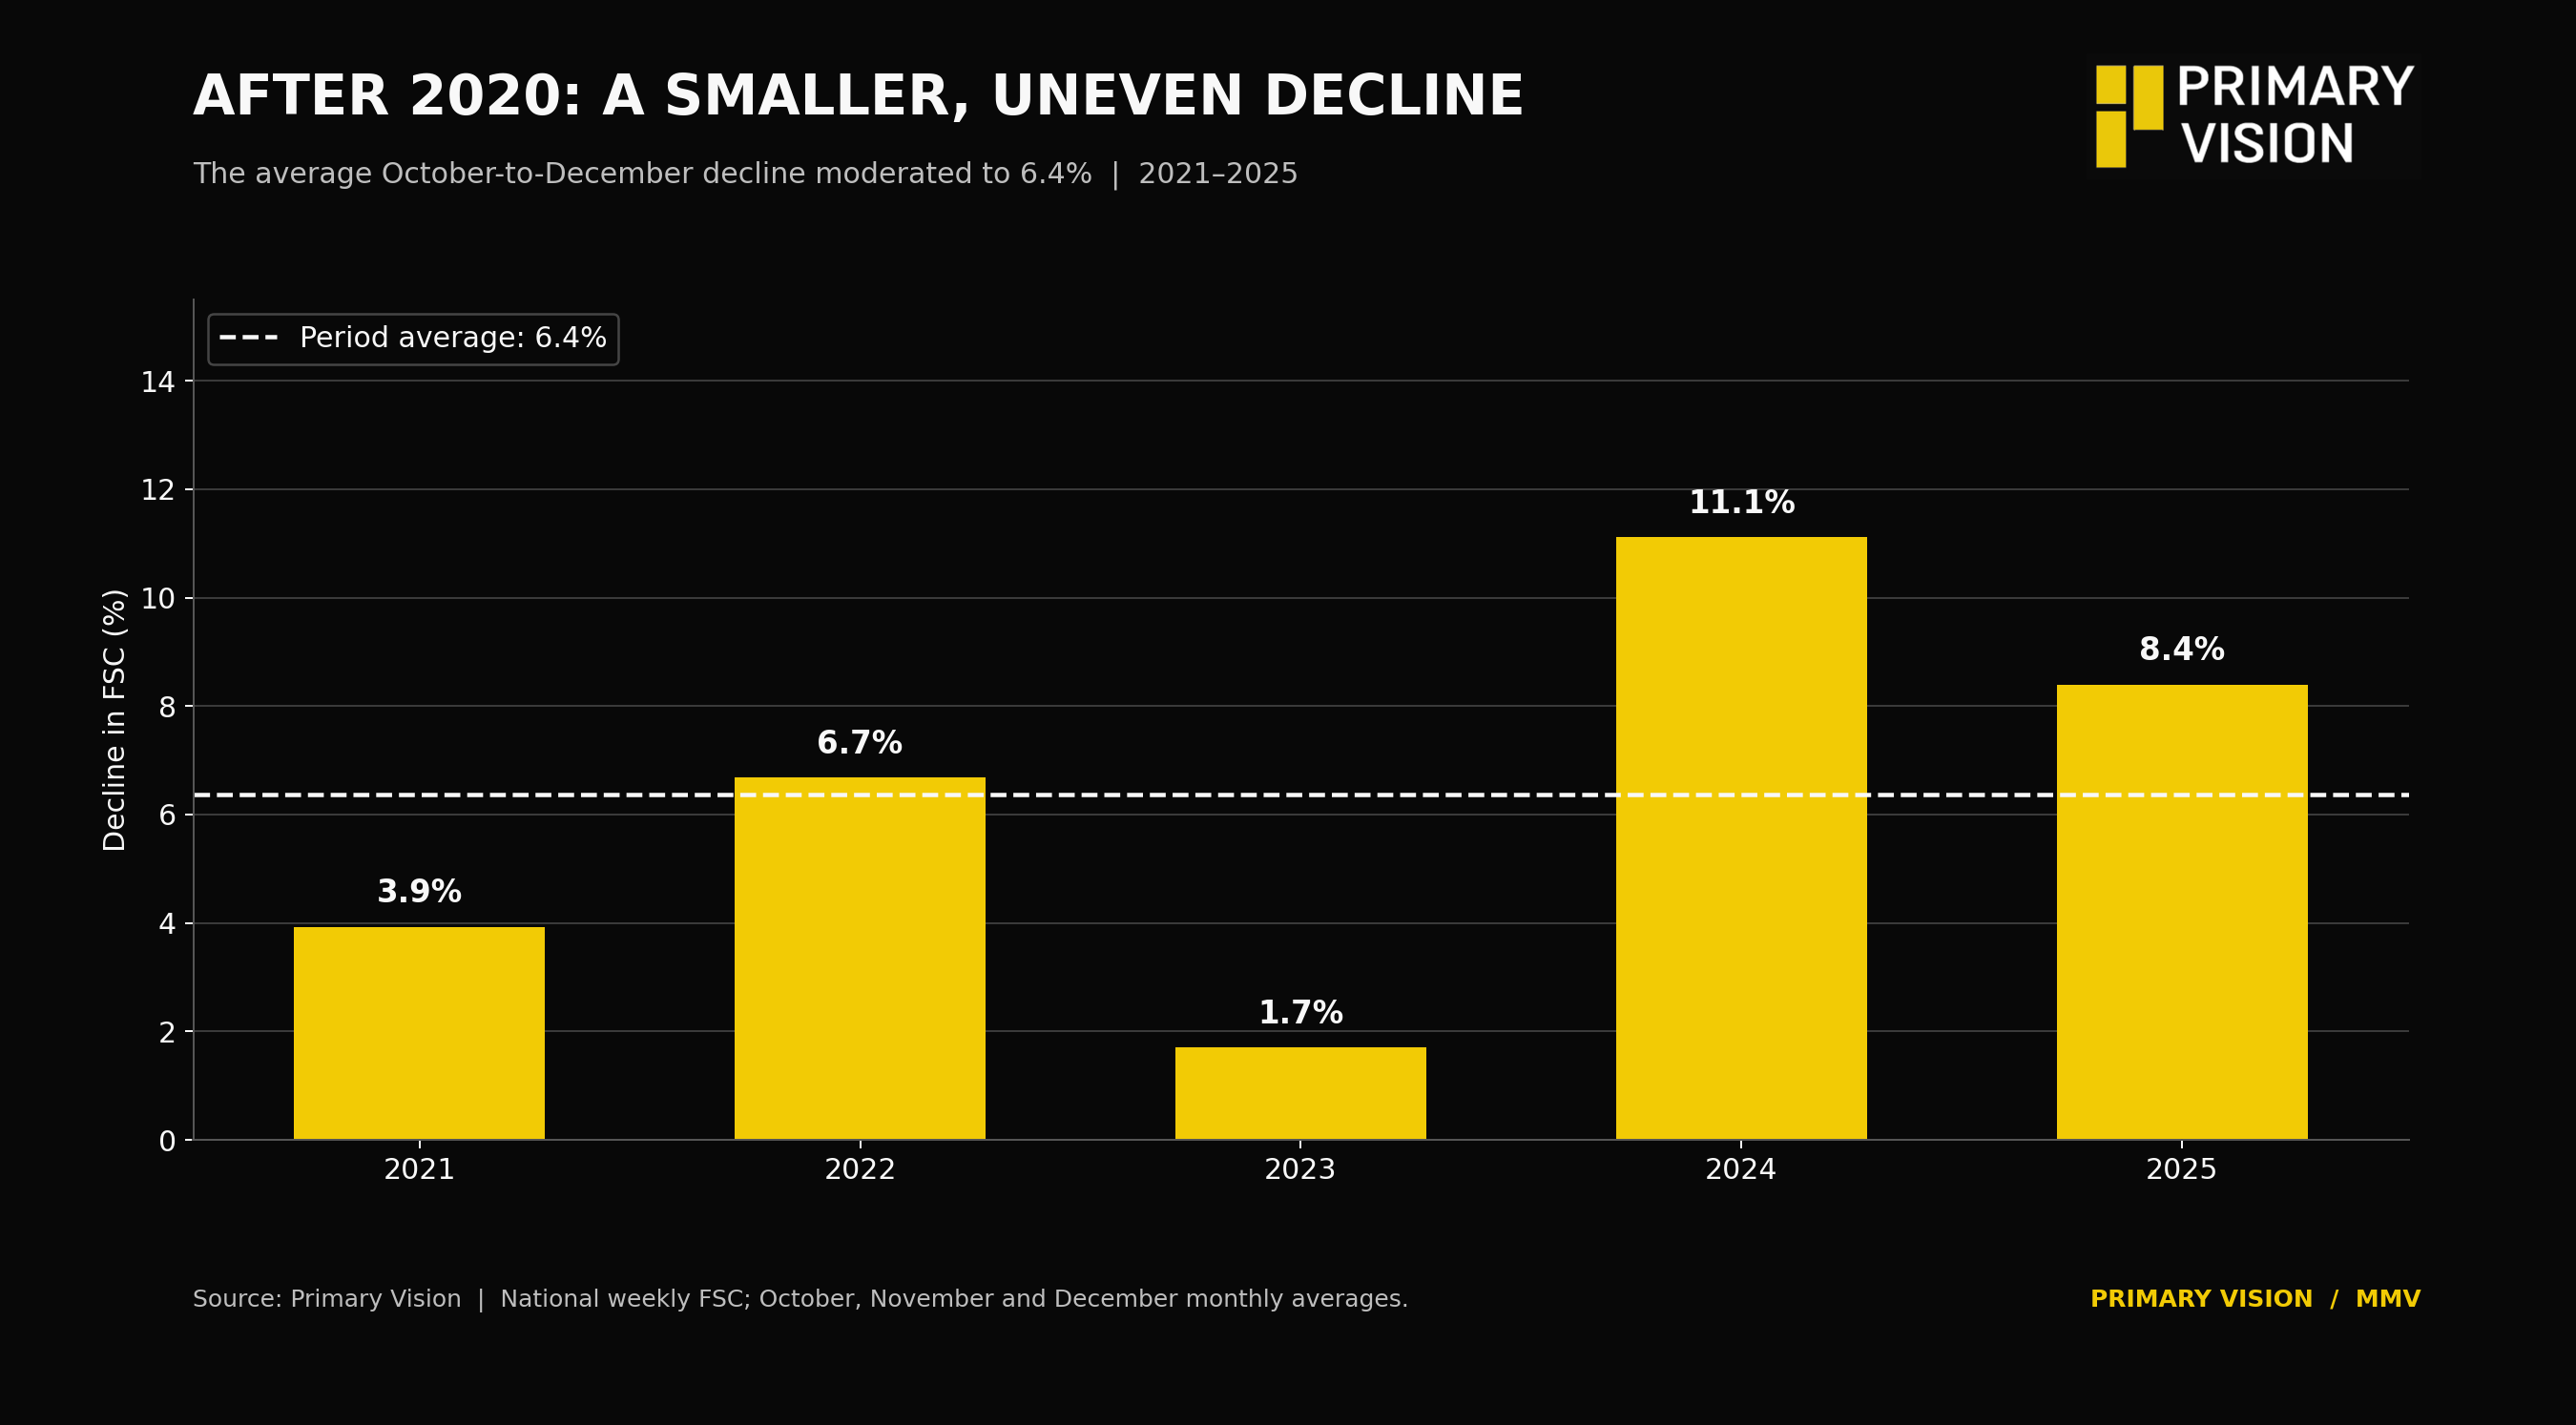
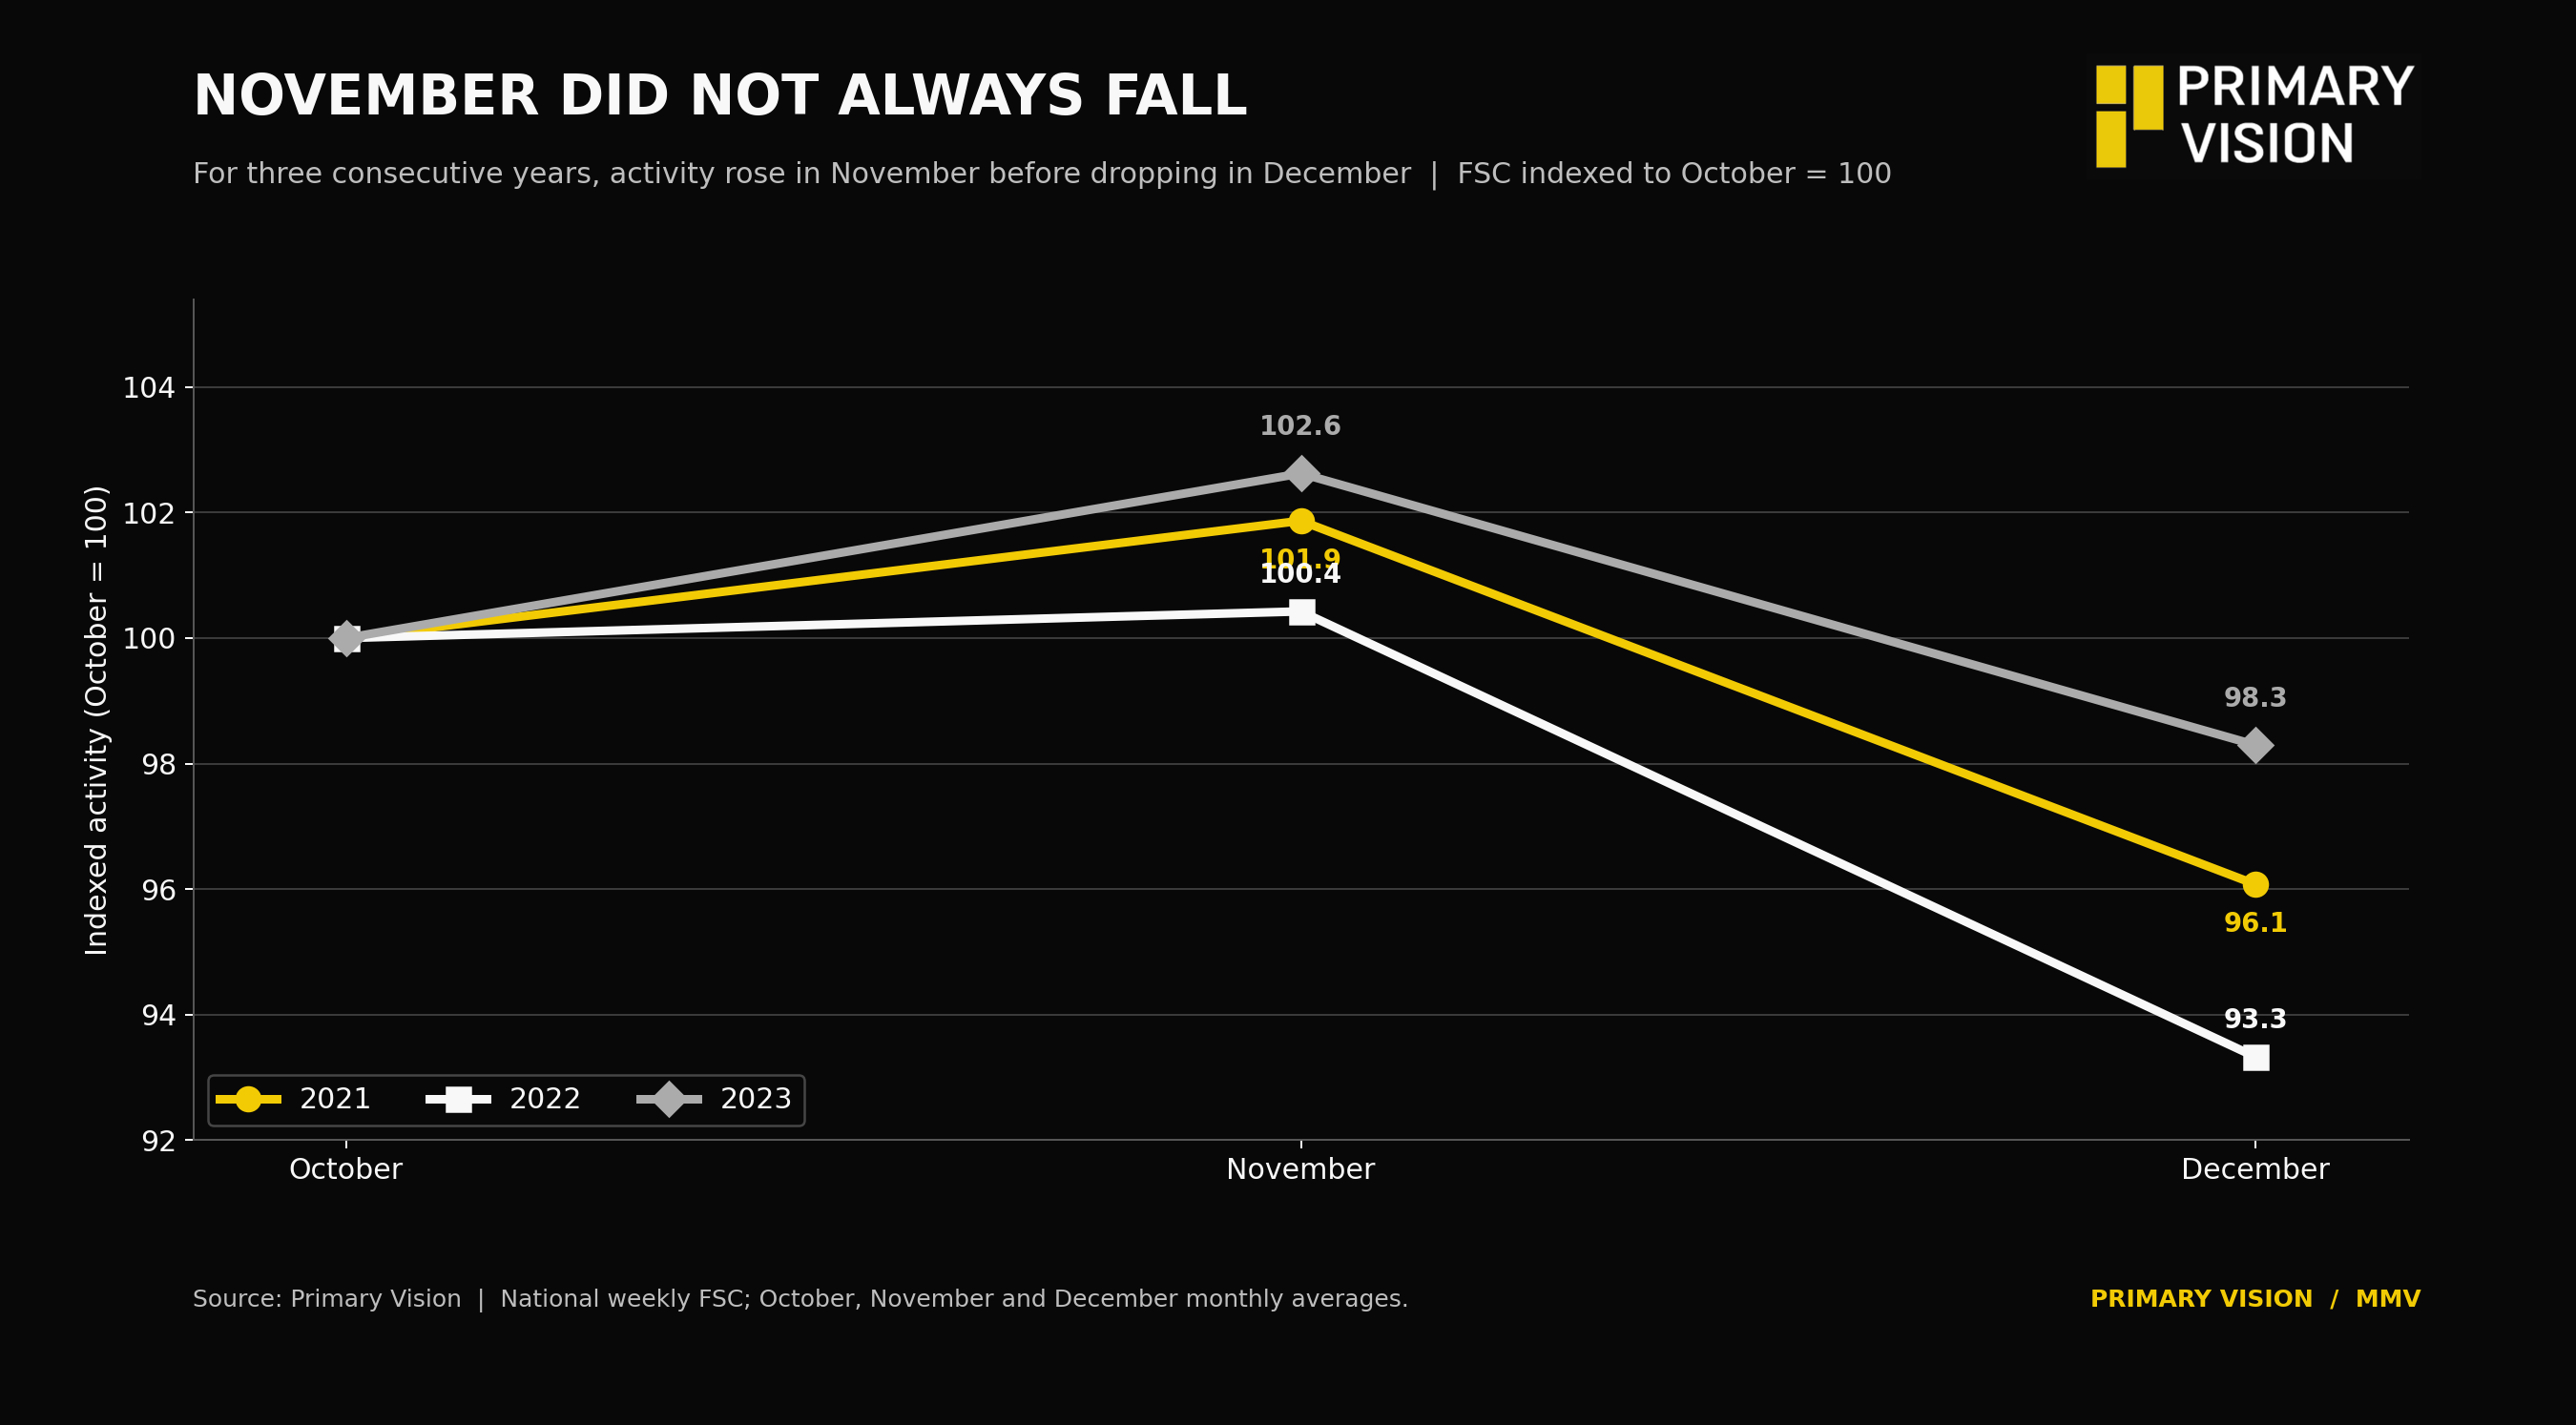
From 2021 through 2025, the average October-to-December decline moderated to approximately 6.4%. In 2021, activity declined by only 3.9%, followed by 6.7% in 2022. The reduction in 2023 was just 1.7%. The numbers suggest that the slowdown may have become less severe. But 2024 and 2025 complicate that picture, with declines of 11.1% and 8.4%, respectively. There's another interesting detail here. In 2021, 2022 and 2023, average activity actually increased between October and November before falling in December. So even when the final two months produce an overall decline, the adjustment doesn't necessarily begin immediately after October.
That distinction is worth remembering when interpreting a few consecutive weekly declines. The usual explanations for year-end weakness include holiday schedules, weather and annual capital budgets. All three have a role to play. But I think the economics of operating a frac fleet deserve greater attention.
A frac spread represents a substantial commitment of equipment, personnel and supporting services. Pressure pumps, blenders, chemical systems, sand logistics and water management all have to work together. Keeping that operation running requires considerable coordination, while temporarily idling equipment carries costs of its own. For a service company, maintaining high utilization helps spread fixed costs across more operating days. For an operator, however, the decision to complete another well depends on expected returns, remaining capital, production targets and available infrastructure.
Those incentives don't always align perfectly.
An operator approaching its annual spending limit may have little reason to accelerate another completion program, even when the service company has equipment available. Conversely, a company with available capital and favorable well economics may choose to continue operations through December. The important point is that the seasonal slowdown reflects decisions made across an interconnected industry. Some are influenced by the calendar, while others depend on economic conditions.
Now look at what's happening in 2026.
The latest FSC reading of 191 remains 16 spreads above the corresponding week in 2025, an increase of approximately 9.1%. October's average was also about 11.5% higher than a year earlier. Meanwhile, the U.S. rig count stood at 603 on October 30, unchanged over the previous two weeks and 57 rigs above the corresponding week last year. The behavior of these two indicators is particularly interesting. Since October 9, FSC has declined from 203 to 191 while the rig count has remained at 603.
There are good reasons these measures don't move together every week. Drilling precedes completion, sometimes by considerable periods, and operators can adjust the timing of those activities independently. Changes in drilled but uncompleted well inventories can also affect how drilling and fracturing activity relate to one another. The divergence therefore deserves attention, particularly if it persists. It may help us distinguish a temporary adjustment in completion schedules from a broader change in upstream activity. There's also a wider question about productivity.
For equipment manufacturers, chemical suppliers and proppant producers, the distinction has commercial consequences. A smaller number of active fleets operating more intensively could generate a different pattern of consumable demand than spread counts alone might suggest. We should also consider what the historical numbers imply for the rest of this year. The average October FSC in 2026 was approximately 197. Applying the 6.4% average October-to-December decline observed during 2021–2025 would produce a December average of roughly 184 spreads.
That is a historical scenario rather than a forecast. The range of outcomes across individual years is wide, and there is no guarantee that 2026 will follow the recent average. But it provides a useful benchmark against which to assess the coming weeks. For the industry, the more consequential issue is how long any slowdown lasts. A brief reduction in activity around the holidays, followed by stronger completions as new budgets take effect, can be managed differently from a prolonged decline that forces service companies to idle equipment and reconsider staffing or capital investment. For suppliers, understanding that distinction can influence everything from inventory planning to contract negotiations.
And that brings us back to the original question. The historical data makes a strong case that year-end seasonality remains part of the U.S. frac market. What has become less predictable is the size of that adjustment and how it unfolds from one month to the next. The industry's operating model has changed enormously over the past decade, yet its annual spending cycles, logistical constraints and commercial incentives continue to shape activity. As we move through November, I'll be particularly interested in whether FSC stabilizes before December, how the relationship between drilling and completions develops, and whether the final weeks of 2026 resemble the relatively modest declines of 2021–2023 or the more pronounced adjustments of the last two years.
After twelve years of data, one lesson stands out: the calendar still has an influence on America's frac market. Understanding how operators respond to it may tell us considerably more about the industry's health than any single weekly reading.
Permission denied
Upgrade to Pro Today and get…
• This article — plus dozens more each month, all within our full Research Module
• Frac Hits — our National-Level Frac Spread Count and Frac Job Count, updated weekly
• Frac Operator Monitor — detailed FSC & FJC by operator
• And so much more, designed to help you track, forecast, and outperform