

Articles
- BLOG / Articles / View
- Articles
Monday Macro View: Is the U.S. immune to an oil supply shock?
By Osama on June 8, 2026 in Market Sentiment
The Frac Spread Count came in at 190 this week, down 2, with the Frac Job Count slipping 3 to 235. Both remain ahead of their year-ago levels—FSC by 4 and FJC by a more meaningful 15—keeping the year-over-year picture constructively positive. The rig count added 1 to reach 563, also 4 above where it was 52 weeks ago. Small moves week-over-week; no change in directional posture.
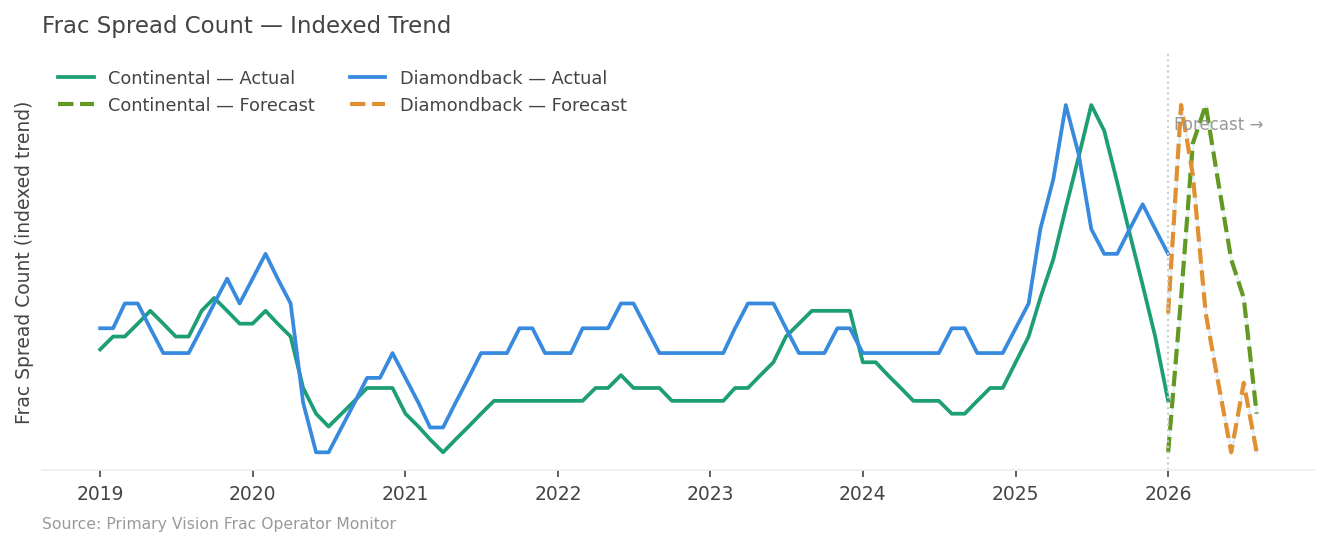
The more interesting story developing in real time is the split emerging between U.S. independents and supermajors on how to respond to $100-plus oil. As per latest estimates, Continental Resources, Diamondback Energy, and EOG Resources have each announced plans to increase capital programs and ramp production in the Lower 48. Diamondback raised its 2026 capex from $3.75 billion to $3.9 billion and lifted output guidance to at least 972,000 barrels of oil equivalent per day. However, Primary Vision's own Frac Operator Monitor tells a more cautious story. Continental's actual spread count peaked near mid-2025 — the company suspended North Dakota operations entirely in early 2026. Diamondback's forecast is a modest recovery. But overall trend has remained upward as shown by both FSC and FJC.
The supermajors, by contrast, are holding their pre-war spending plans firm. Chevron's CFO put it plainly: "You wouldn't expect us to be changing our plans significantly on the back of eight weeks of disruption." But now we are beyond that point. That divergence matters for the completions market—it is the independents, not the majors, who drive frac spread demand at the basin level, and their willingness to accelerate programs is the signal that pressure pumpers are watching most closely right now. Separately, on the policy front, the U.S. House passed the License to Drill Act (H.R. 7831) on June 4, reauthorizing the Permit Processing Improvement Fund through 2037. The PPIF is funded entirely by operator fees and supports BLM staffing in key producing states including New Mexico, Wyoming, North Dakota, Utah, and Colorado—states that collectively sit at the heart of federal lands completions activity. The bill now moves to the Senate ahead of the program's September expiration. It is not a dramatic policy shift, but letting it lapse would have introduced real friction into federal permitting pipelines at precisely the moment independents are looking to move faster.
Another macro story commanding the most serious analytical attention this week came from the Federal Reserve Bank of Boston, which on June 4 published a paper reassessing how exposed the U.S. economy actually is to oil price shocks. The backdrop matters: WTI jumped from $65 in February to nearly $100 in May following the de facto closure of the Strait of Hormuz, through which roughly one-fifth of the world's seaborne oil trade normally passes. Using a method developed by economist James Hamilton that isolates price surges exceeding recent highs, the authors calculate the current shock at approximately 33%—about half the magnitude of the 1973 OPEC embargo, but larger than what was seen at the outset of Russia's 2022 invasion of Ukraine.
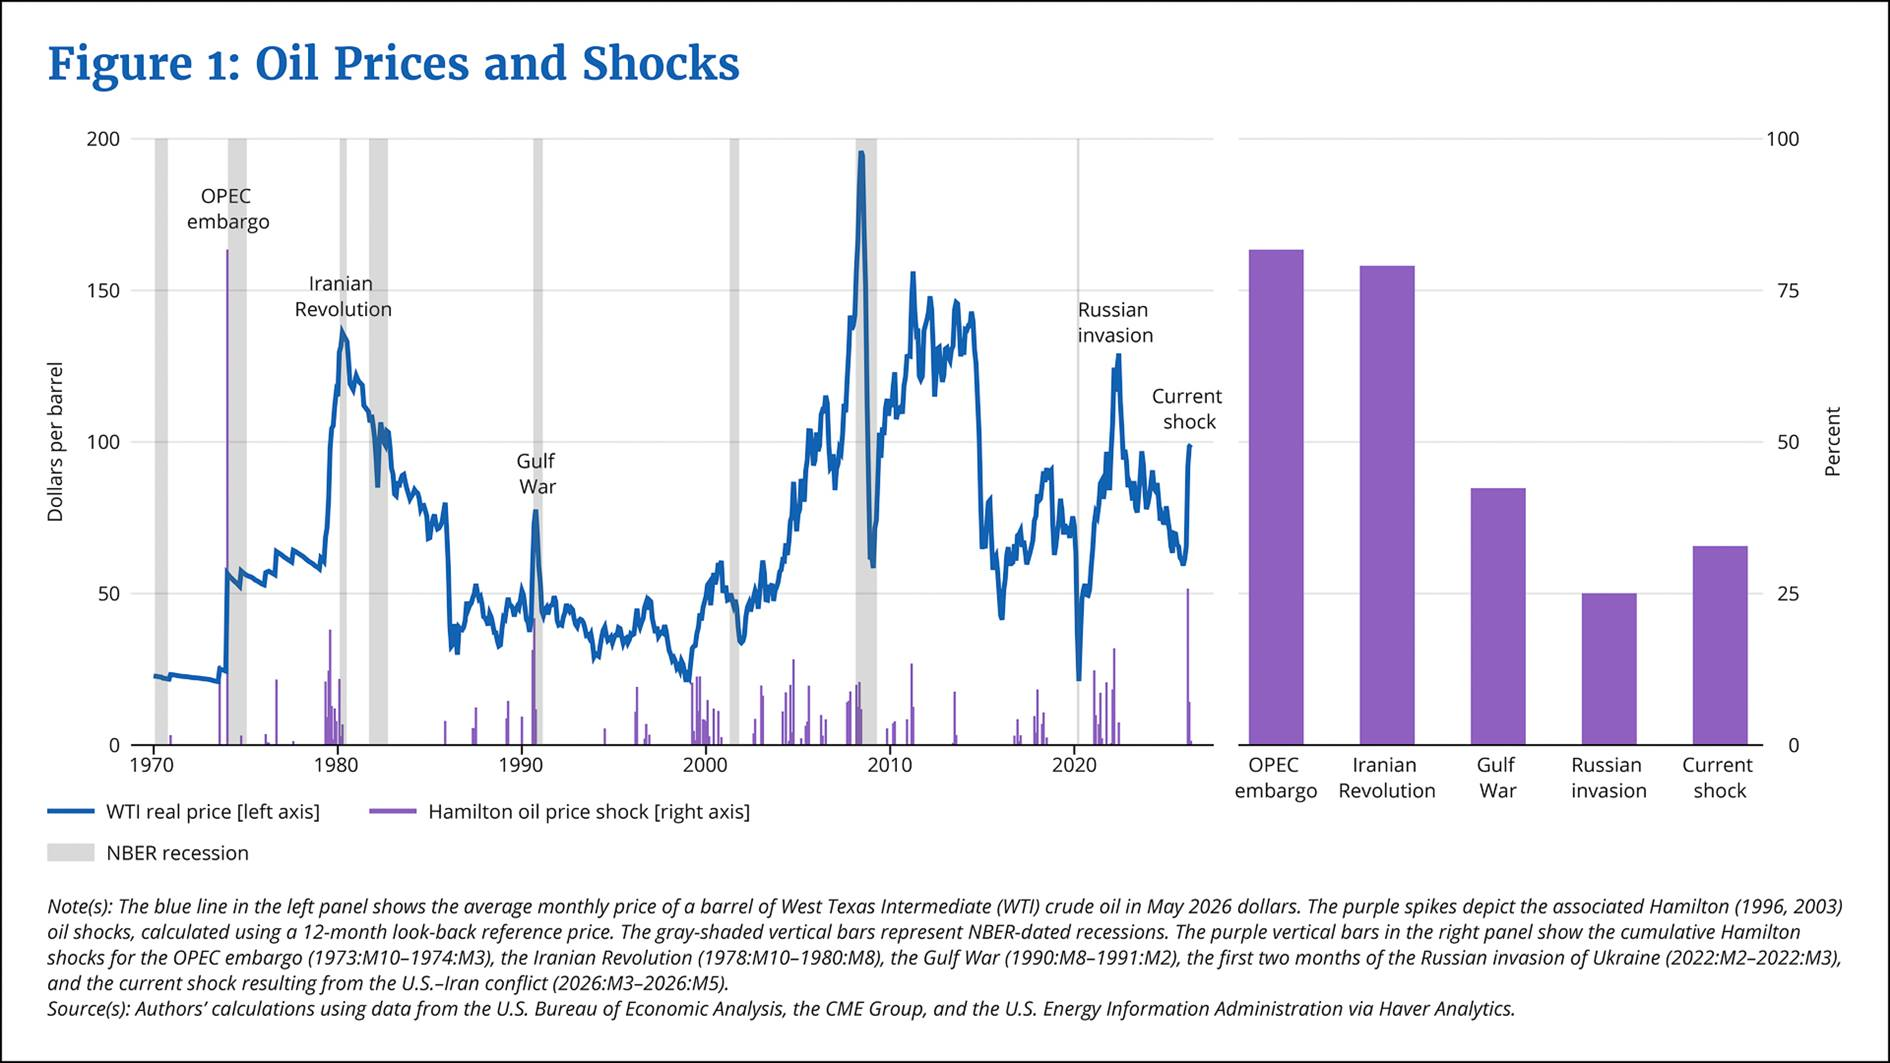
The paper's core finding is that this shock hits differently than it would have fifty years ago. A 33% oil price increase is now associated with roughly a 1.5 percentage point rise in PCE inflation over the following year, down from 2.2 points before the mid-1980s. The employment effect has essentially disappeared. In the 1970s, a shock of equivalent size was associated with a 1.8 percentage point drag on national employment growth. That relationship vanished around 2010—precisely when the shale revolution, enabled by hydraulic fracturing, began dramatically expanding domestic oil output. The U.S. moved from net oil importer to net exporter by 2019, and the economy now uses less than one-third the oil per unit of real output it consumed in the 1970s.
The regional dimension of the paper is equally worth sitting with. The authors find that oil-producing states—Texas, New Mexico, North Dakota, Oklahoma, and Alaska account for 82% of national extraction output—gain jobs relative to oil-importing states when prices spike, creating a geographic offset that buffers national employment. But the authors flag a consequential wrinkle: because the economy absorbs the shock without much employment damage, there is correspondingly less disinflationary pressure to counterbalance the inflation being generated by higher energy prices. The EIA's May Short-Term Energy Outlook expects Brent to average around $106 per barrel through June before easing, while PCE inflation had already moved from 2.9% in February to 3.8% in April. The Fed's tradeoff has shifted: more inflation to manage, less labor market cover to justify moving slowly on rates.
That monetary policy implication is the part of the Boston Fed paper that bears most directly on the activity outlook. A Fed that stays tighter for longer because oil-driven inflation proves sticky is a meaningful constraint on E&P capital programs, even in an environment where producer economics look attractive on the surface. Primary Vision's constructive view of U.S. completion activity rests on the premise that sustained elevated prices eventually translate into committed operator spending—the roughly three-month price hold that historically precedes meaningful activity gains. We are early in that clock. The data is holding. But the path higher runs through a monetary environment that is more complicated than the price chart alone would suggest.
Tags:
Permission denied
Upgrade to Pro Today and get…
• This article — plus dozens more each month, all within our full Research Module
• Frac Hits — our National-Level Frac Spread Count and Frac Job Count, updated weekly
• Frac Operator Monitor — detailed FSC & FJC by operator
• And so much more, designed to help you track, forecast, and outperform


