Monday Macro View: U.S. shale continues to show strength
By
Osama
on May 4, 2026
in
Market Sentiment
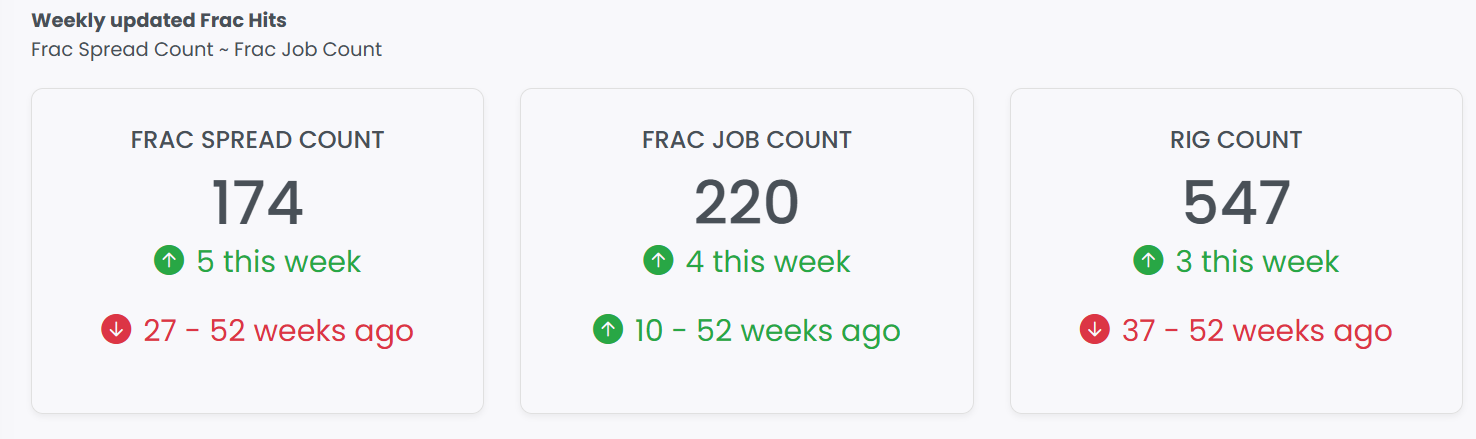
Hello everyone! Welcome to the first Monday Macro View of May'26. It is an interesting one. The momentum continues to build. FSC rose 5 to 174, FJC added 4 to 220, and the FJC now sits 10 counts above its year-ago level. Those are numbers that confirm what service operators have been reporting anecdotally for weeks. Liberty Energy's frac schedule went from wide open in late February to sold out through year-end by early April. Cyclone Drilling's salespeople went from having twice the rigs they needed to having half. The completion data are catching up to what is already happening in the field: the available pressure pumping fleet is being absorbed faster than at any point since 2022, and the binding constraint on activity growth has quietly shifted from operator willingness to physical service capacity.
The clearest evidence of that shift came from the EIA's weekly data. US crude exports hit a record 6.44 million barrels per day for the week ending April 24, flipping the country to net crude exporter status on a weekly basis for the first time since 1943. Crude inventories fell 6.2 million barrels. Gasoline stocks dropped for the eleventh consecutive week, with NYMEX gasoline futures touching $3.65 per gallon. Total petroleum product exports reached 14.18 million bpd. The world is pulling every available US barrel, and it is pulling them into a market where the Strait of Hormuz remains effectively closed, roughly 20% of global seaborne oil flow is offline, and there is no diplomatic resolution in sight.
Washington is doing two things simultaneously. The Department of Energy has released 17.5 million barrels from the SPR since mid-March, including 7.1 million barrels in the most recent week. The release is structured as an exchange requiring return volumes within a year, which means every barrel drawn today creates a procurement obligation for 2027. At the same time, US crude production reached 13.6 million bpd in February, near the all-time high. The tension is obvious: record production, record exports, and the government is still cracking open the strategic reserve. That tells you the gap between what the world demands from American supply and what current capacity can deliver.
The EIA's April STEO forecasts Brent peaking near $115 per barrel in Q2 before easing later in 2026, with the Brent-WTI spread expected to peak at $15. But the more interesting question is what happens to service pricing. The demand for drilling activity seems to increase. But this demand may also result in service price inflation - something to watch for moving forward. Readers should be watching for that in Q2 earnings calls from Halliburton, Liberty, and ProPetro.
In other news, we continue to monitor the global fracking activity as well. The latest is that Libya's NOC signed an MOU with Chevron to assess unconventional resources in the Sirte, Murzuq, and Ghadames basins, with preliminary estimates of 18 billion barrels and 123 Tcf of gas. Any Libyan unconventional production is years from market impact, but the deal itself signals something worth noting: the Hormuz crisis is accelerating the global hunt for shale-capable resource plays, and US technical expertise is the currency.
The structural backdrop shifted further when the UAE exited OPEC effective May 1, removing the group's third-largest producer and its stated ambition to reach 5 million bpd by 2027. For medium-term supply projections, this is significant: analysts expect Abu Dhabi to ramp production once the Hormuz bottleneck clears, adding barrels outside OPEC discipline. In the near term, though, a closed strait means UAE spare capacity stays exactly that. The net effect for US completion activity is that the call on American crude continues to grow, the service sector is hitting capacity walls, and the bottleneck has moved from the boardroom to the well pad.
Upgrade to Pro Today and get…
• This article — plus dozens more each month, all within our full Research Module
• Frac Hits — our National-Level Frac Spread Count and Frac Job Count, updated weekly
• Frac Operator Monitor — detailed FSC & FJC by operator
• And so much more, designed to help you track, forecast, and outperform