






Articles
- BLOG / Articles / View
- Articles
Monday Macro View: We knew prices push frac activity. Here's how long it lasts.
By Osama on July 27, 2026 in Market Sentiment
A few weeks ago we noticed something worth digging into further. Our earlier work had already shown that when crude prices stay elevated for about three months, Primary Vision's Frac Spread Count and Frac Job Count reliably tick up afterward. That part wasn't in question. What we wanted to investigate further was what happens next: once that uptick shows up, how long does it actually stick around before fading, and does it ever show up in the one number that matters most to producers and investors alike, actual barrels of US crude coming out of the ground.
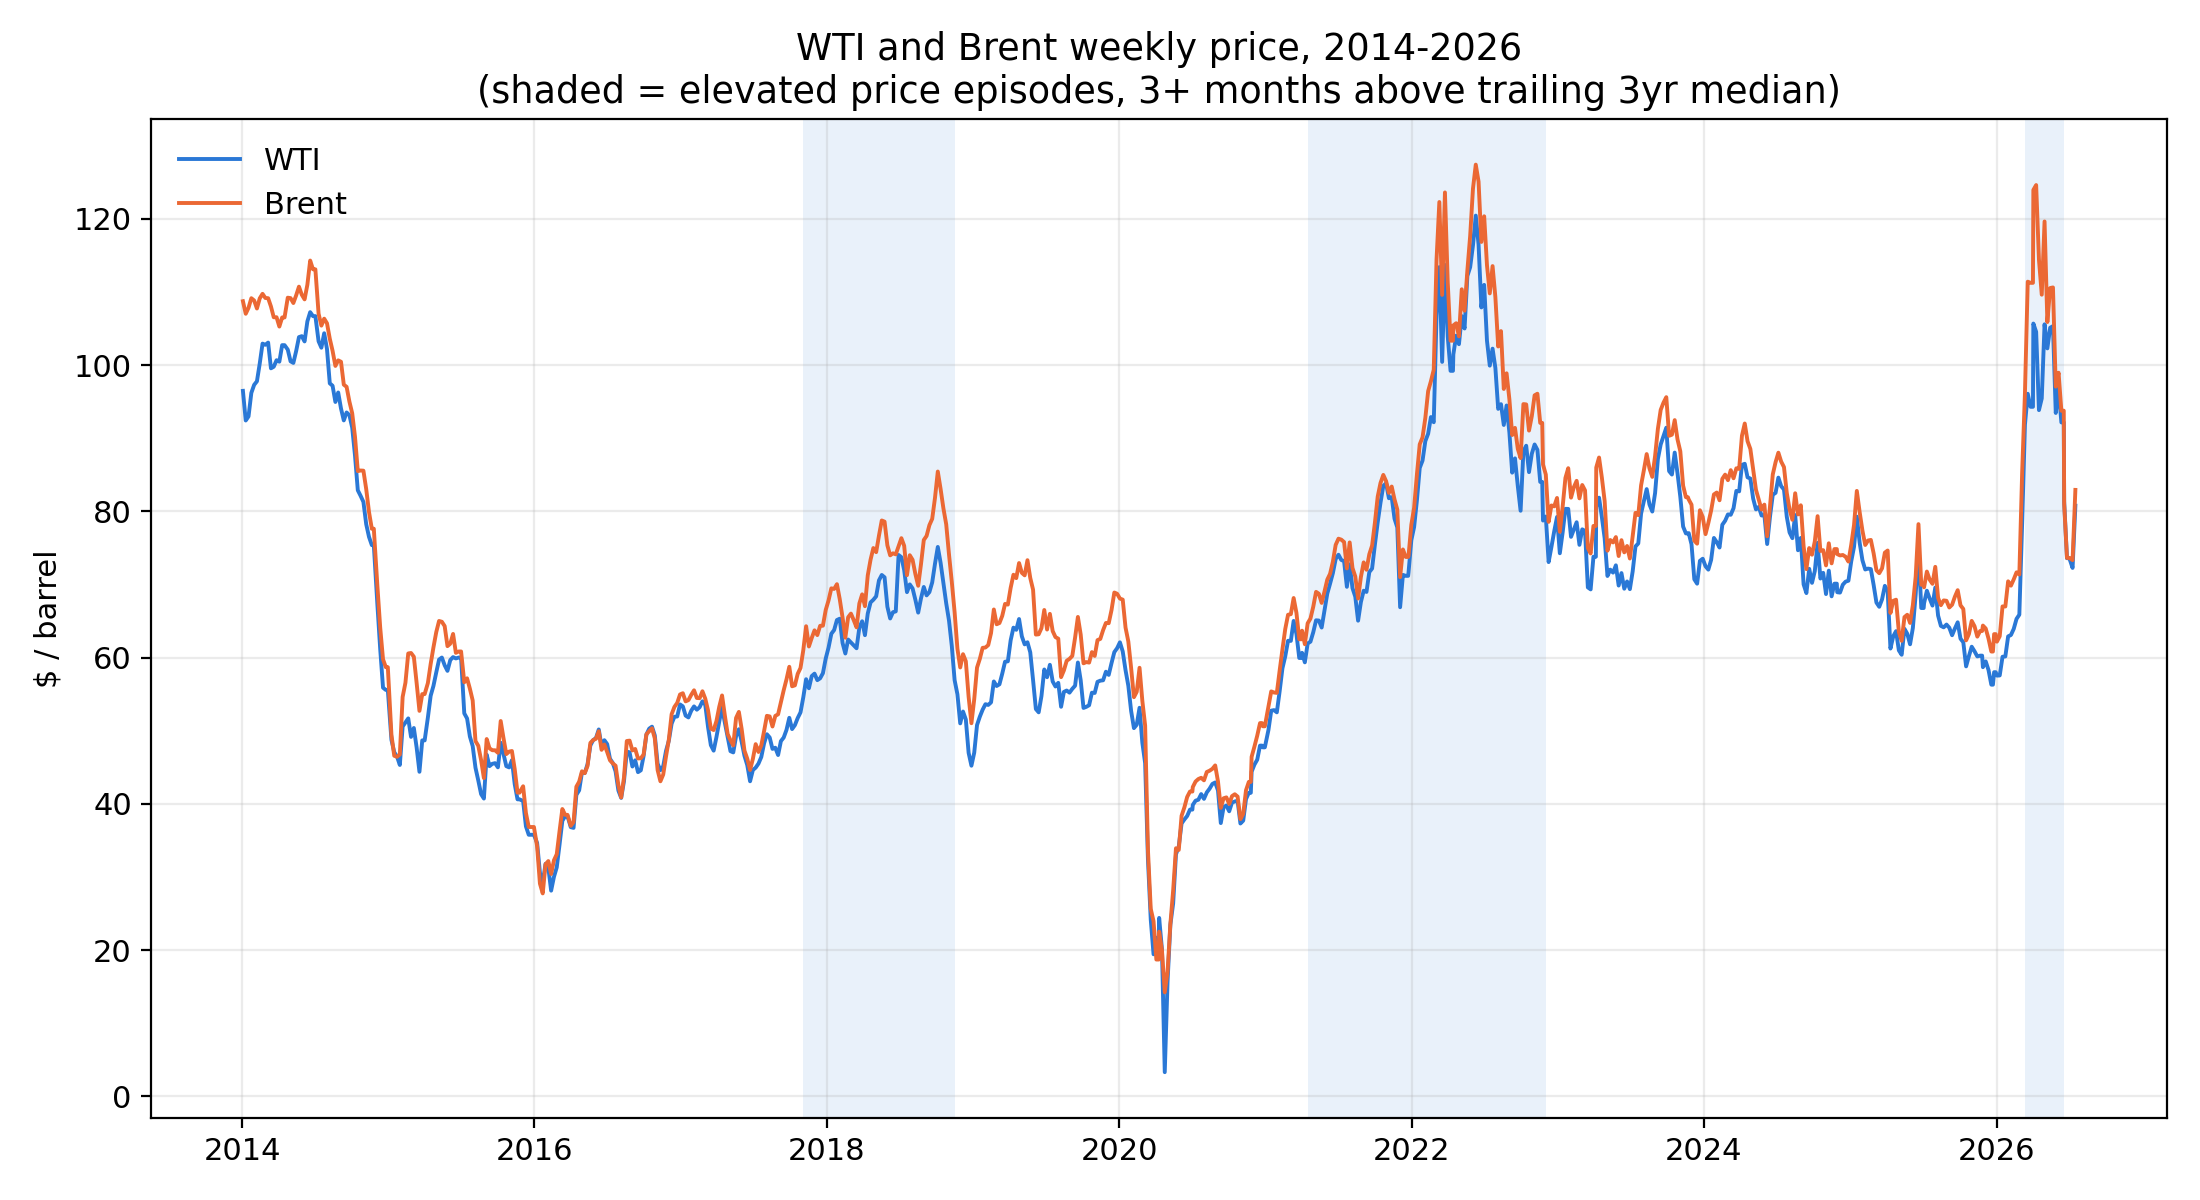
Here is the methodology used in the article. It takes into account the weekly price of WTI and Brent going back to 2014, and for each week check whether the price was sitting more than 10% above its own trailing three-year median. Whenever that condition held for at least thirteen straight weeks, roughly three months, that stretch got flagged as an "elevated price episode." That gave a clean, repeatable definition of the exact scenario our earlier analysis was built on, rather than picking episodes by eye.
From there, for every episode found, we tracked what FSC and FJC did in the weeks and months that followed: how high they eventually rose relative to where they started, how many weeks it took to reach that peak, and then, critically, how many weeks after the episode began it took for the count to fall back down near its pre-episode level. The same exercise was run on weekly US crude field production, since that's the real economic payoff of all that frac activity.
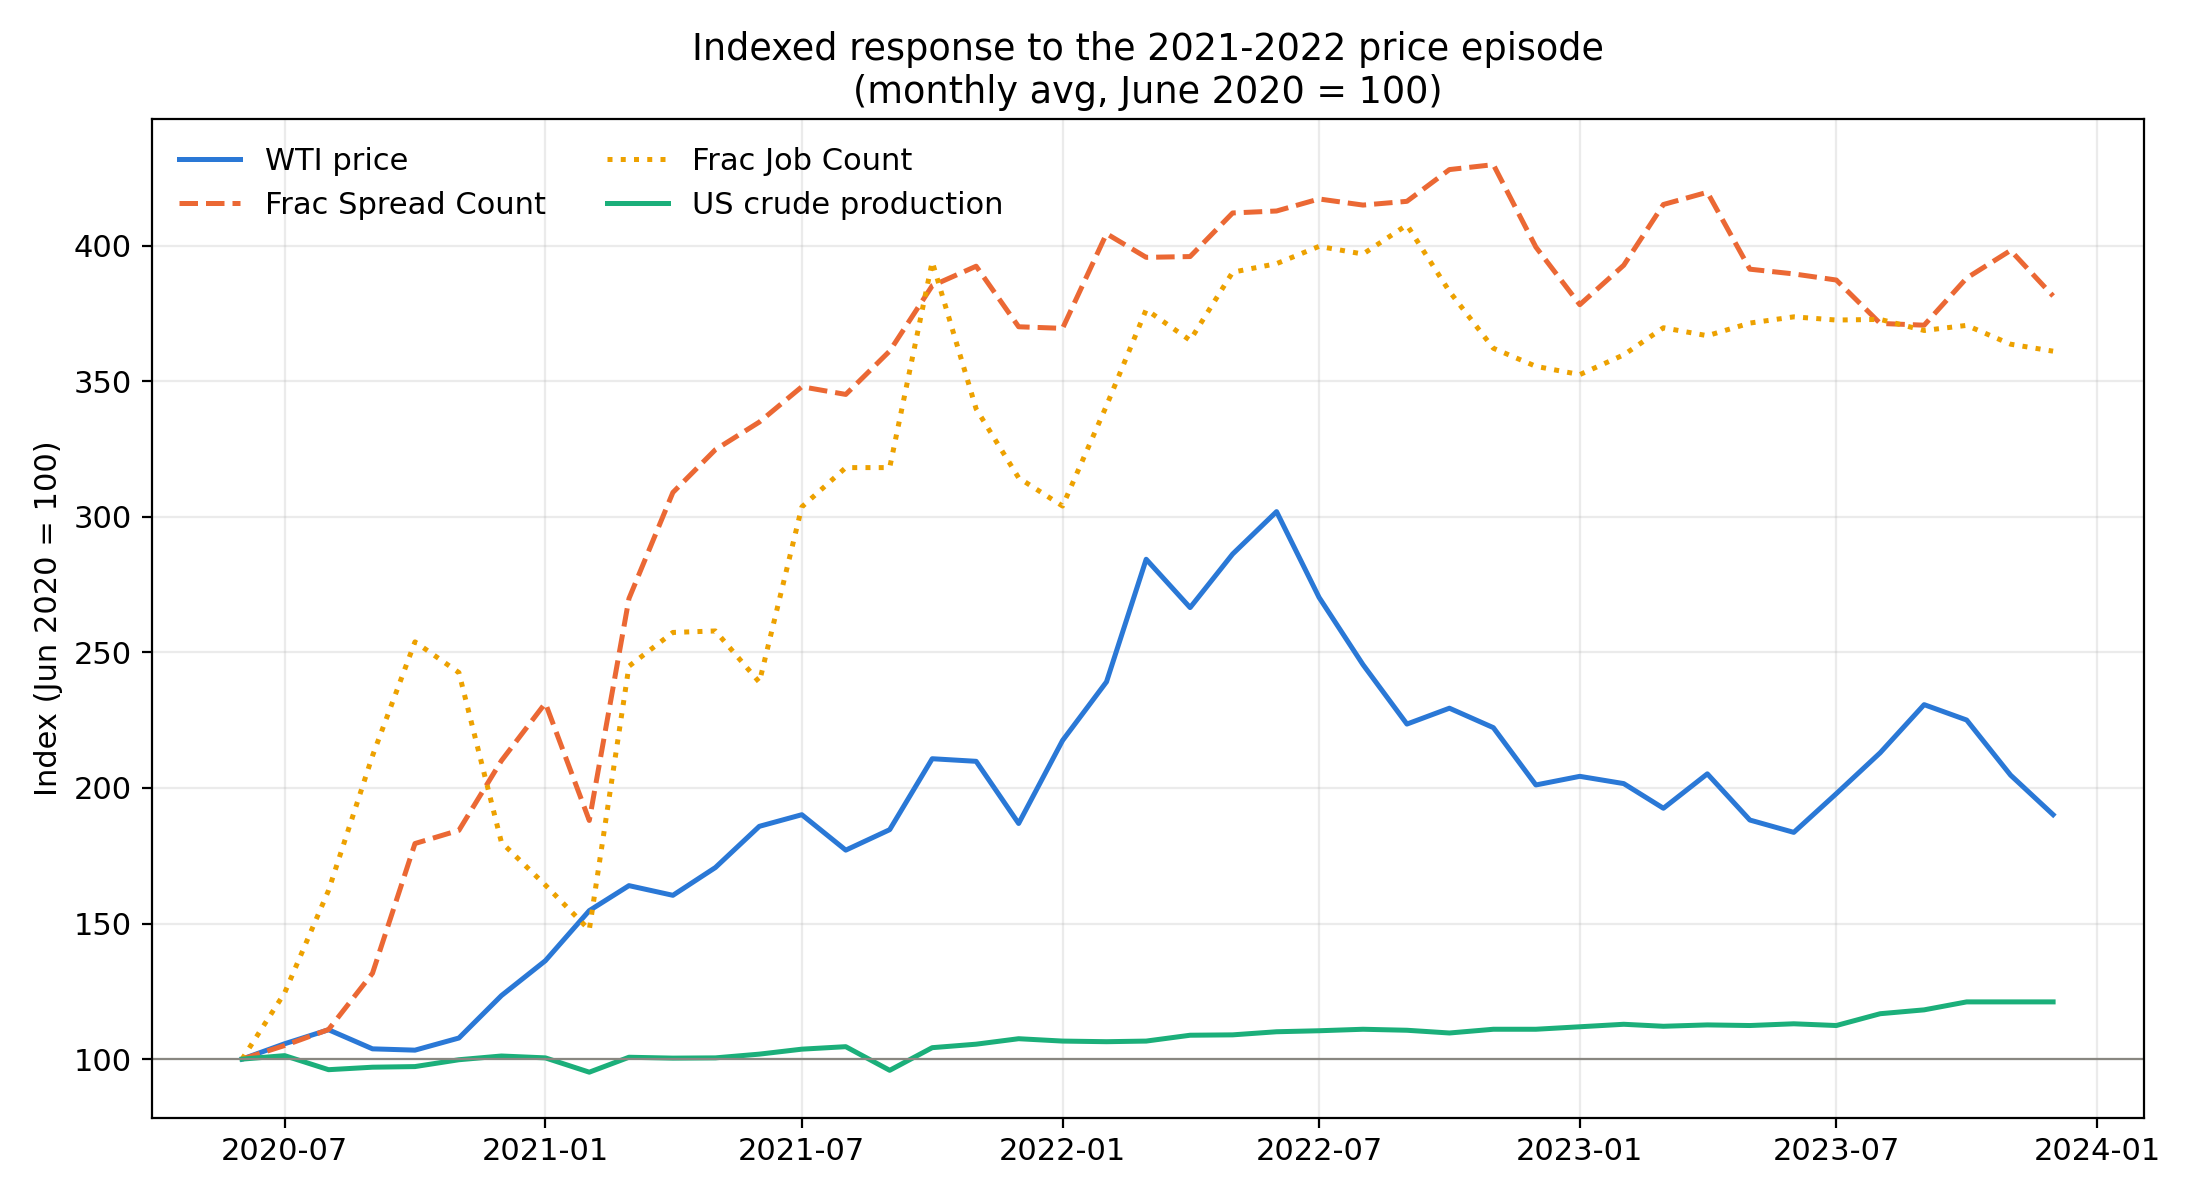
NOTE: This chart uses an index (June 2020 = 100), not real units — it shows % change from each series' own starting point, not actual dollars, barrels, or counts. For real barrels/day, see last chart
Four episodes came out of this, and the exact numbers tell the story better than the percentages alone. Late 2017 into late 2018, WTI ran about 21% above baseline; FSC rose from a pre-episode level of roughly 417 to a peak of 503, and production climbed from about 9.51 million barrels a day to 12.60 million, though that peak didn't land until nearly two years (100 weeks) after the price move started. The April 2021-December 2022 episode was the largest: WTI up 54%, FSC rising from about 195 to 300, FJC nearly doubling from about 151 to 304, and production moving from 10.90 million to 12.30 million barrels a day, a peak that arrived roughly 97 weeks (about 22 months) after the episode began. The current episode, running since March 2026, has WTI up 28%, FSC moving from about 160 to 205 so far, FJC from about 203 to 243, and production has barely stirred, up from 13.70 million to 13.80 million barrels a day, still early in its response.
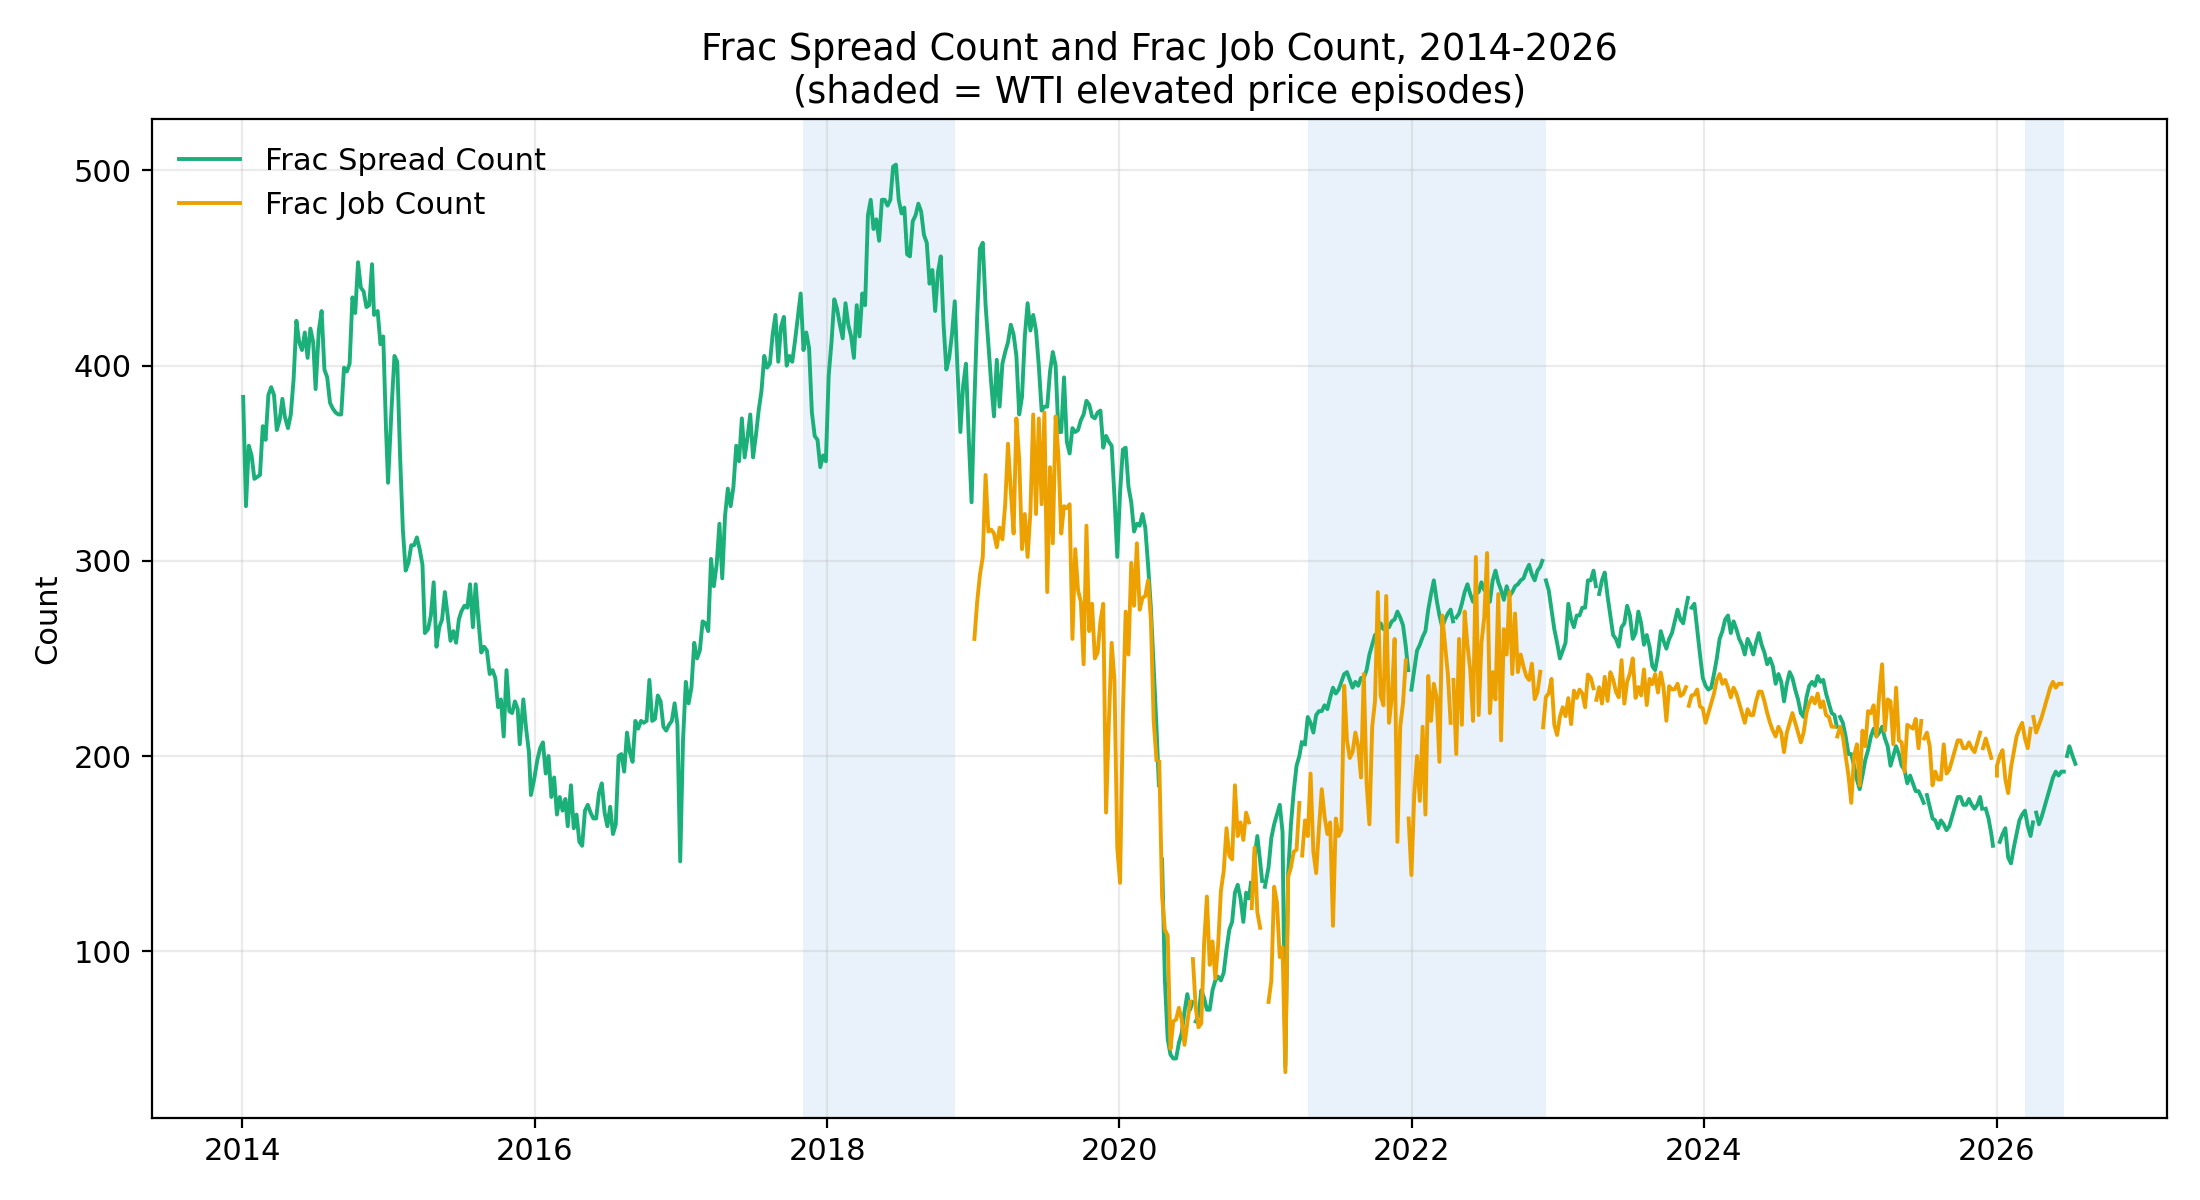
The lingering question is the one that matters most. In every episode with enough time elapsed to check, FSC and FJC stayed elevated for many months after their initial move, not weeks. In the 2017-18 case it took eight to twelve months for FSC to decay back toward its pre-episode baseline. In the 2021-22 case, FSC and FJC were still elevated more than two years after the price spike began, never fully reverting within the two-year window checked. That's a long tail, not a short-lived bump.
Production tells a different story. It does eventually respond, rising anywhere from about 1.1 million to 3.1 million barrels a day depending on the episode, but the lag is far longer than FSC or FJC, typically close to two years, and the percentage move (12-33%) is consistently smaller than the frac activity response (20-100%+). That fits the standard explanation: completions ramp up well ahead of new barrels reaching the market, and drawing down the inventory of already-drilled-but-uncompleted wells can let production move somewhat independently of frac activity in the short run.
Primary Vision's own CAI tool offers a useful forward-looking check on this. Its production forecast for U.S. field output shows the recent climb to roughly 14 million barrels a day essentially staying consistent through 2027, with the model's confidence interval widening from about 13 million to 15 million barrels a day as the forecast horizon extends. That's consistent with the lag pattern found above: production typically takes close to two years to fully register a price episode, and since the current elevated-price window only opened in March 2026 our forecast is holding output consistent until more data comes in to confirm the size and durability of the move.
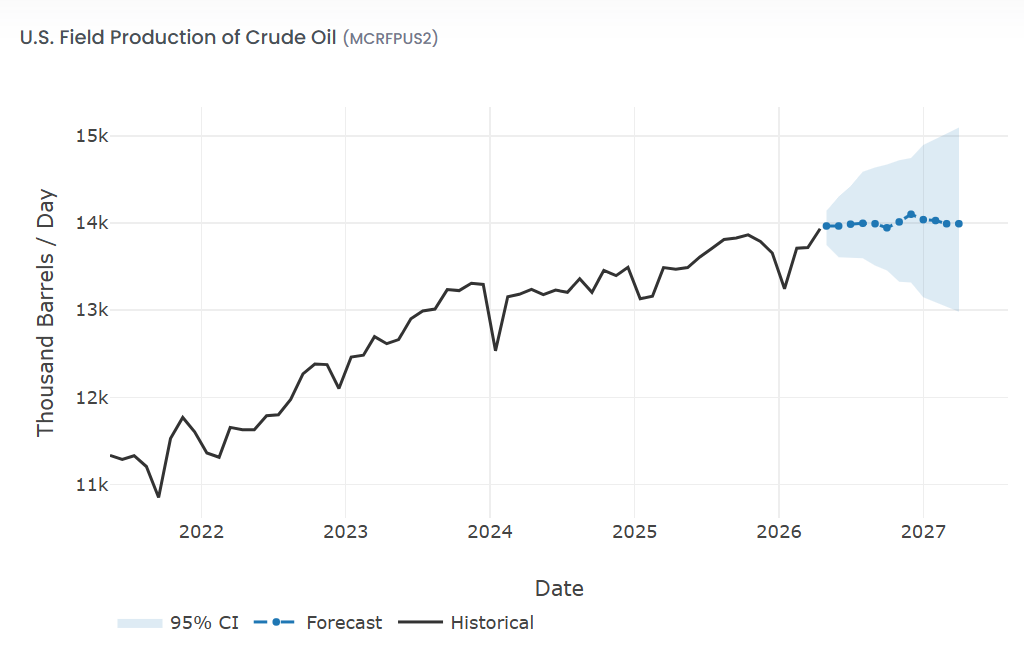
Frac spread counts are expected to hold above 200 through November as completion efficiency keeps climbing, with as many as four new production records likely within six months — a trajectory closer to the extended 2021-22 cycle than the shorter 2017-18 one, pointing toward strength persisting well into 2027.
Tags:
Permission denied
Upgrade to Pro Today and get…
• This article — plus dozens more each month, all within our full Research Module
• Frac Hits — our National-Level Frac Spread Count and Frac Job Count, updated weekly
• Frac Operator Monitor — detailed FSC & FJC by operator
• And so much more, designed to help you track, forecast, and outperform