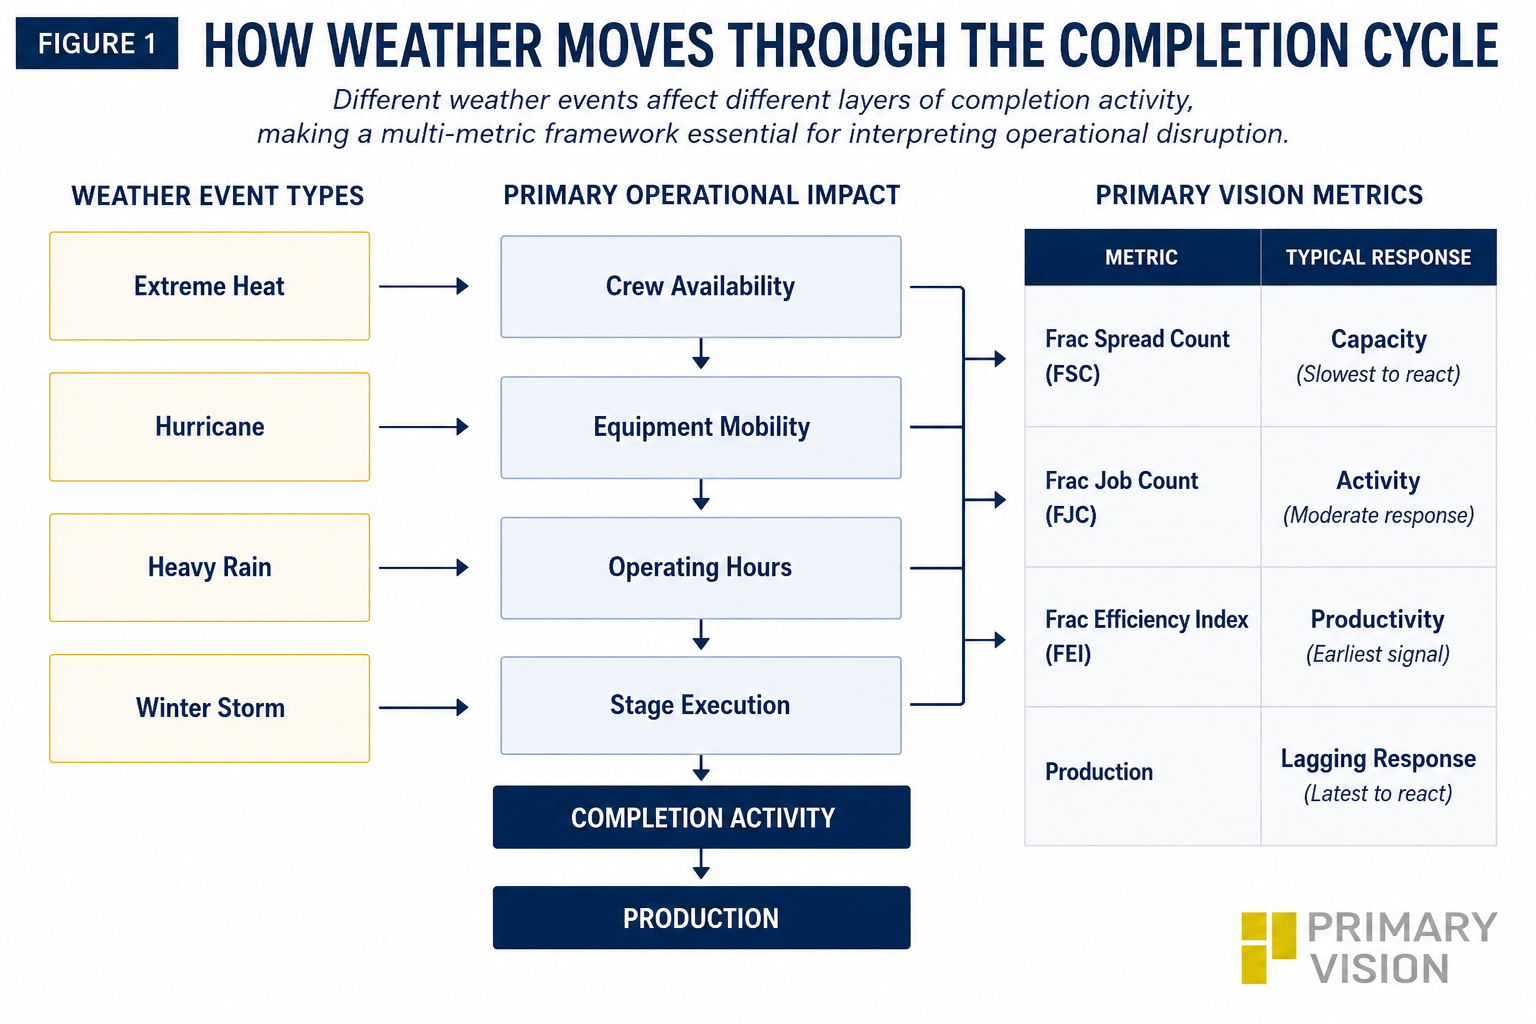
Weather demonstrates why that approach matters. Operational disruptions rarely affect every layer of the completion process at the same time. Temporary weather events may delay work or reduce operating hours without removing active fleets from the field. As a result, one dataset may appear unchanged while operational performance begins to soften beneath the surface. Figure 1 below illustrates this relationship, showing why different completion metrics respond differently to the same weather event.
Historical Hurricanes Produced Limited Capacity Disruption
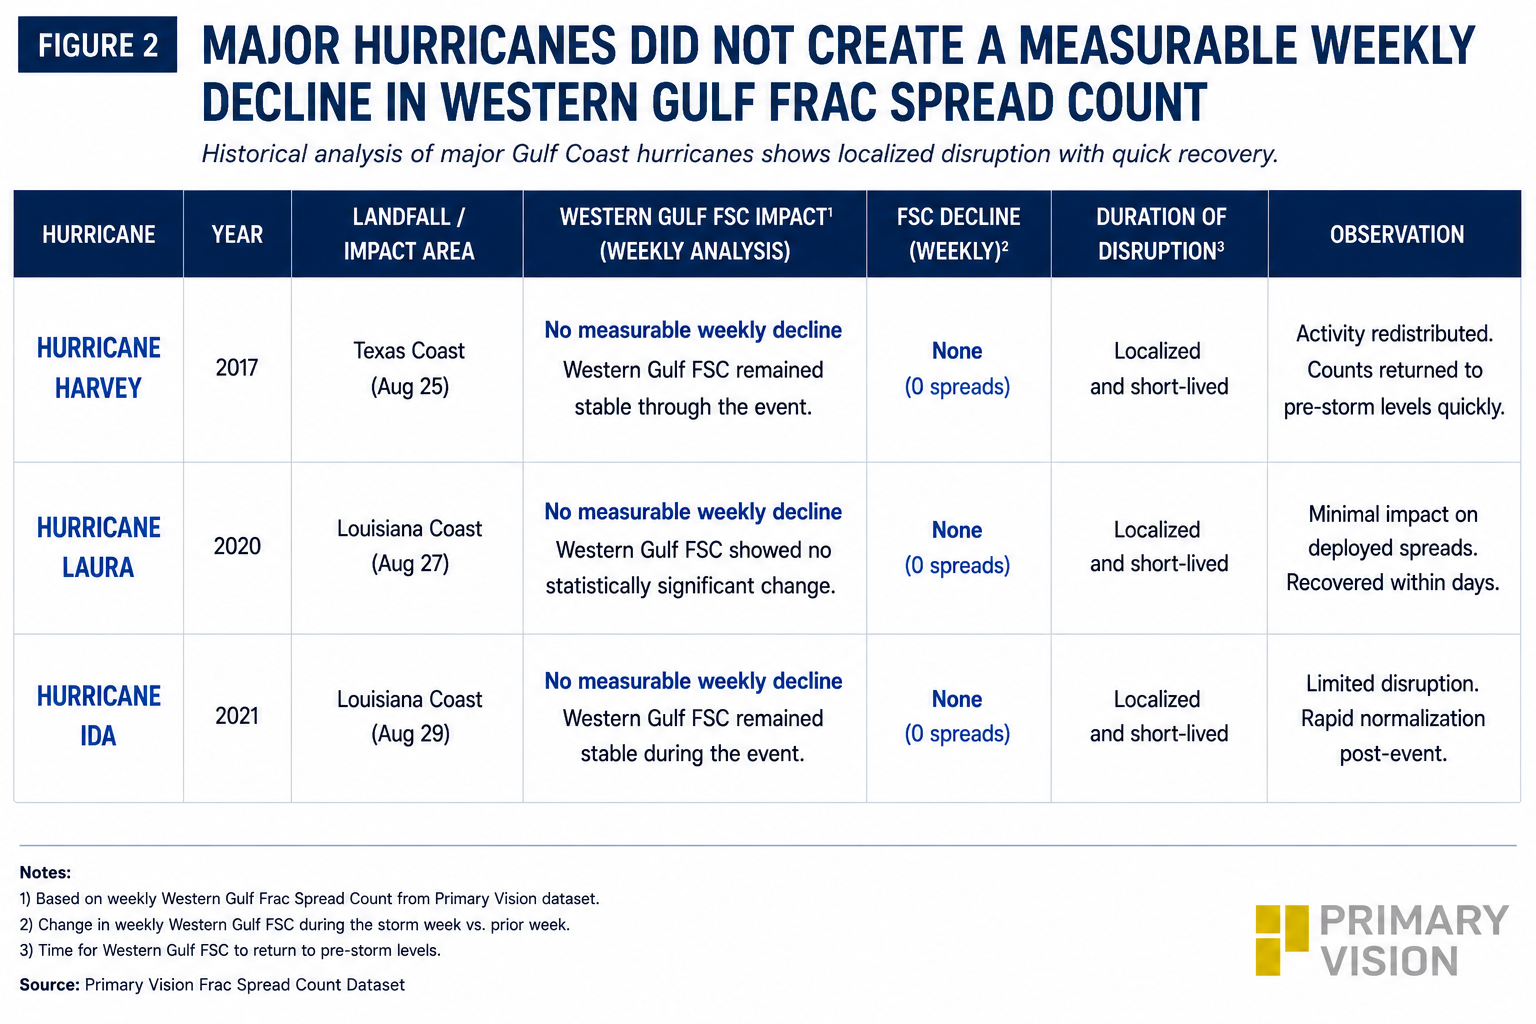
Hurricanes are often assumed to reduce deployed completion capacity. Primary Vision's historical analysis suggests otherwise. Reviewing Harvey (2017), Laura (2020), and Ida (2021) found no measurable weekly decline in Western Gulf Frac Spread Count. Activity slowed locally, but deployed capacity remained broadly intact and recovered quickly.
Figure 2 highlights this finding. The historical evidence suggests hurricanes created localized, short-duration operational disruption rather than structural reductions in deployed completion capacity. Weather should therefore be viewed primarily as a disruption-risk indicator rather than an automatic signal for lower Frac Spread Count.
Seasonality Is Less Reliable Than Commonly Assumed
Historical data also challenges another widely held assumption. Analysis of 2017-2025 Frac Spread Count shows no consistent national August increase. While some years experienced seasonal strength, the timing and magnitude varied enough that August cannot be treated as a dependable indicator of higher completion activity. Current operating conditions therefore provide a more reliable guide than the calendar alone when assessing near-term completion trends.
Weather May Affect Productivity Before Capacity
The analysis also identifies an important limitation of relying solely on Frac Spread Count. Primary Vision’s analysis concludes that heat deserves further analysis against Frac Job Count, Frac Efficiency Index (FEI), stages completed and operating hours, rather than Frac Spread Count itself. Temporary operational delays may leave active spread counts unchanged while reducing overall productivity, making activity and efficiency metrics more sensitive indicators of weather-related disruption.
Final Commentary
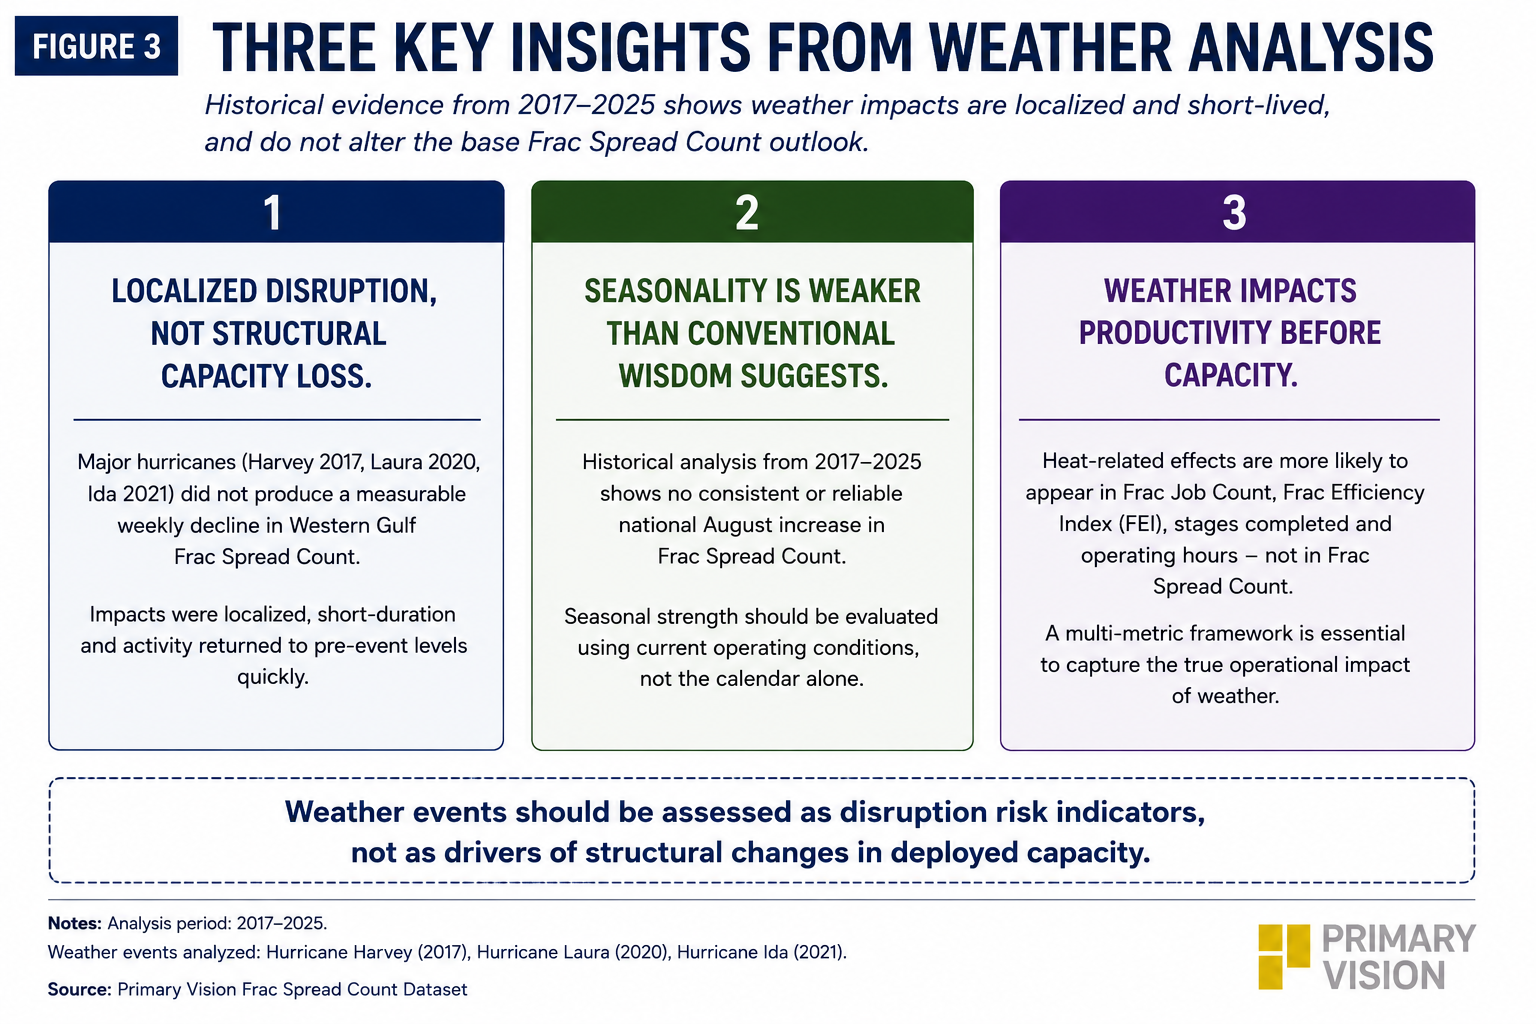
Primary Vision's historical analysis produces three clear conclusions. First, major hurricanes created localized disruption but did not produce measurable weekly declines in Western Gulf Frac Spread Count. Second, historical data does not support a reliable national August increase in activity. Third, weather impacts are more likely to emerge through Frac Job Count, Frac Efficiency Index (FEI), stages completed, and operating hours than through deployed spread counts alone.
Figure 3 brings these findings together. The broader conclusion extends beyond weather itself. As demonstrated in Part 1, no single dataset fully explains today's completion market. Weather simply reinforces why capacity, activity, and efficiency must be evaluated together to understand how operational conditions influence the North American completion cycle.
Having established how capacity, activity, and weather interact, look out for the final articlein the series, which applies the framework at the company level to identify which pressure pumpers are converting deployed fleets into the strongest operational performance.
Upgrade to Pro Today and get…
• This article — plus dozens more each month, all within our full Research Module
• Frac Hits — our National-Level Frac Spread Count and Frac Job Count, updated weekly
• Frac Operator Monitor — detailed FSC & FJC by operator
• And so much more, designed to help you track, forecast, and outperform