

Articles
- BLOG / Articles / View
- Articles
Break-even Price Series: Operators: Who Stand Where?
By Avik on November 22, 2025 in Articles
Series Framework
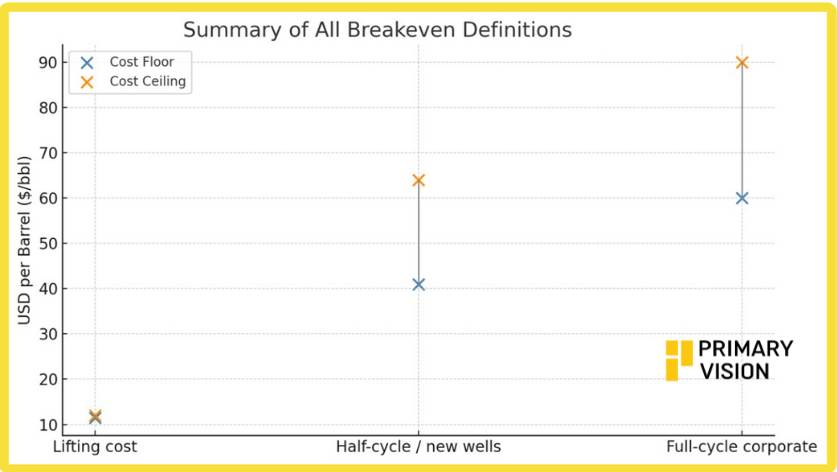
As discussed in the previous episode of the series written by Osama, recent data place Lifting or production costs at the existing wells at about $11–12 per barrel for major U.S. producers. Half-cycle breakevens, which include drilling, completion, and transport, average roughly $41 for existing wells and $62–64 for new Permian wells. Full-cycle breakevens, which add land, overhead, and capital costs, typically range between $60 and $90 per barrel.
Let us now test this against what energy operators are doing on the ground and how sustainable their operation is. Obviously, the companies are always evolving to meet challenges with efficiency and innovation. So, the jury is still out. But it will give us a measure of their resilience when things start going down.
Demystifying Costs
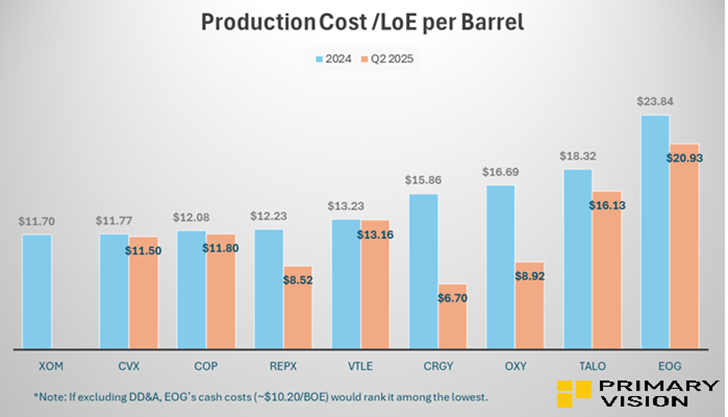
Across the group, lifting costs (LOE) range widely from about ~$12 per barrel for XOM—the lowest among peers—to around $16/barrel for TALO in 2024, reflecting differences in basin quality and operational scale. VTLE and CRGY maintain midrange LOEs near $13–15 per barrel, reflecting differences in basin quality and operational scale. Smaller producers like TALO sat in the $18 range, with higher unit costs driven by lower production volumes and more localized infrastructure.
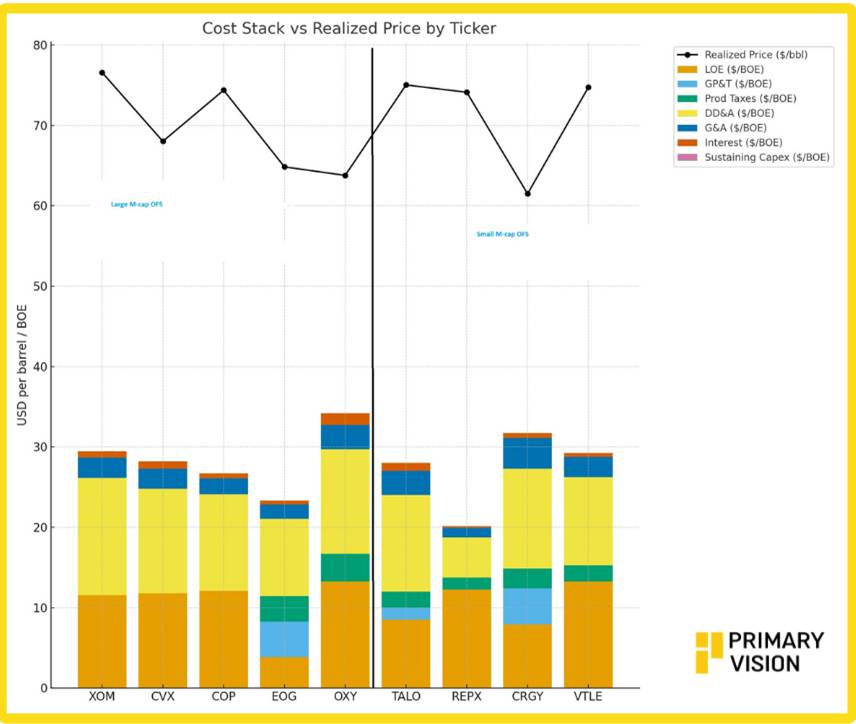
Stepping toward the full production cost, we add the depreciation, depletion, and amortization (DD&A) costs, which capture the capitalized drilling and development spend. Add to these G&A and interest expense, reflecting overhead and financing. Summing these components yields the total per-barrel cost, which, when subtracted from the realized crude price, defines the operating margin per barrel.
As we see above, large-cap producers like XOM, CVX, and COP show lower total cost stacks (around $25–30/BOE) and maintain wide margins versus realized prices above $65–75/bbl, highlighting their scale and efficiency. Smaller and mid-cap peers such as OXY, CRGY, and VTLE exhibit higher cost layers (approaching $30–35/BOE) and narrower margin cushions, reflecting greater exposure to price swings and less integrated diversification.
Ideally, the estimated income from every barrel of oil sold by the producers should shadow the operator’s net income. In other words,
MBOED × Margin × 365 days ~ Net income
MBOED = thousand barrels of oil equivalent per day
Margin ($/BOE) = Revenue minus production cost per barrel
Reported net income is in millions USD.
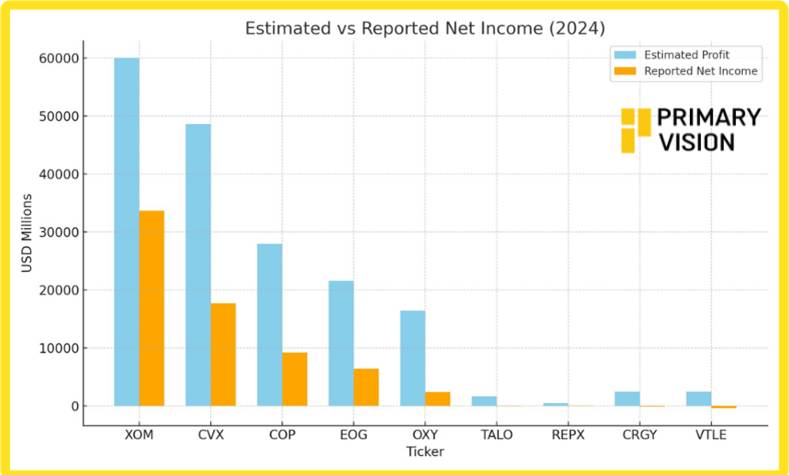
The gap between reported net income and estimated profit stems from factors not captured in the simplified margin-based estimate, which are:
- Significant non-cash charges like depreciation, depletion, and amortization (DD&A) reduce net income for large operators
- Negative net income (TALO, CRGY, VTLE) likely reflects impairments or write-downs for small market-cap operators
- Estimated profits exclude capex (e.g., drilling, facilities), which is significant for growth-focused firms like OXY or CRGY. Full-cycle costs (land, overhead) also reduce net income
Large operators (XOM, CVX, COP, EOG, OXY) leverage scale for lower unit costs ($11.70–23.84/BOE) and robust margins ($37.53–51.40/BOE), but non-cash charges and capex create large gaps between reported and estimated profits. Small operators (TALO, REPX, CRGY, VTLE) show competitive margins but face negative net income due to impairments and higher breakeven needs, with cost reductions (e.g., CRGY, REPX) signaling improving cash flows. The table underscores that while all operators benefit from realized prices ($68–79/bbl) exceeding costs, non-operational factors significantly impact reported profitability.
Cost Structure Impact: Large vs. Small Caps
If we dive deeper into these companies’ cost structure, XOM and CVX, with their integrated structures create volatility between upstream and refining earnings, with chemicals and refining underperforming even as upstream remained strong. ConocoPhillips and EOG display a much closer fit, reflecting their pure-play upstream focus and efficient cost bases. The small differences for these two mainly arise from taxes and timing effects, showing that their reported profitability closely mirrors the underlying per-barrel economics.
Among the smaller and mid-cap players, Occidental’s earnings were hit by high interest and non-cash charges in FY2024. Talos reported a loss despite positive operating margins because of decommissioning and exploration expenses. Crescent Energy and Vital Energy show similar patterns, where financing costs and asset impairments overwhelmed operating cash flow. In contrast, Riley Exploration’s simpler, low-cost Permian model produces results closely aligned with operational margins. Overall, small caps exhibit greater sensitivity to debt, hedging, and one-time charges, which obscure their otherwise solid per-barrel economics.
Takeaways: What The Production Cost Structure Tells Us
The industry’s cost dynamics reveal a clear divide in resilience. Large integrated producers maintain efficient operations and diversified revenue streams that help them absorb pricing pressure. Their scale advantage keeps unit costs contained and supports healthy margins, even when crude prices soften. Operational discipline and integration across upstream and downstream segments further buffer earnings volatility.
Smaller and mid-cap operators, however, face tighter economics. While several demonstrate strong field efficiency, their profitability is more vulnerable to financing costs, impairments, and one-off charges. Without the benefit of scale or integration, they depend heavily on stable prices and access to low-cost capital. The takeaway is that size, balance sheet strength, and operational integration remain the most effective defenses against a prolonged downturn in crude markets.
Tags:
Permission denied
Upgrade to Pro Today and get…
• This article — plus dozens more each month, all within our full Research Module
• Frac Hits — our National-Level Frac Spread Count and Frac Job Count, updated weekly
• Frac Operator Monitor — detailed FSC & FJC by operator
• And so much more, designed to help you track, forecast, and outperform


