

Articles
- BLOG / Articles / View
- Articles
OFS Ranking Index: Structure Holds, but Discipline Is Driving Re-Rating
By Avik on March 30, 2026 in Articles
The Message Inside The Ranking
The OFS Index remains broadly stable from Q3 to Q4. Read our previous ranking article to understand the perspective. However, beneath that stability, the underlying drivers have shifted meaningfully. Structural leadership remains intact, but relative positioning is now being reshaped by capital discipline, backlog visibility, and early-cycle supply tightening signals. While top-tier scores remain largely unchanged, dispersion within the mid and lower tiers has widened. This indicates that the cycle is not improving yet, but the setup beneath it is becoming more constructive.
What changed in Q4 — and why it matters
The framework remains unchanged, but Q4 introduces a shift in what the model rewards. Score changes are now driven less by activity and more by positioning into the next phase of the cycle. Capacity discipline is emerging as a leading indicator, particularly within pressure pumping, where idling and attrition are tightening supply. Backlog visibility, especially in offshore and international markets, is improving confidence in medium-term earnings. At the same time, exposure to LNG, power, and data center–linked demand is beginning to influence structural positioning.
As a result, the sector appears stable at the surface. However, I think the more important development is that execution and positioning are now driving incremental re-rating, even without meaningful activity growth.
Top tier: Structural leadership remains intact
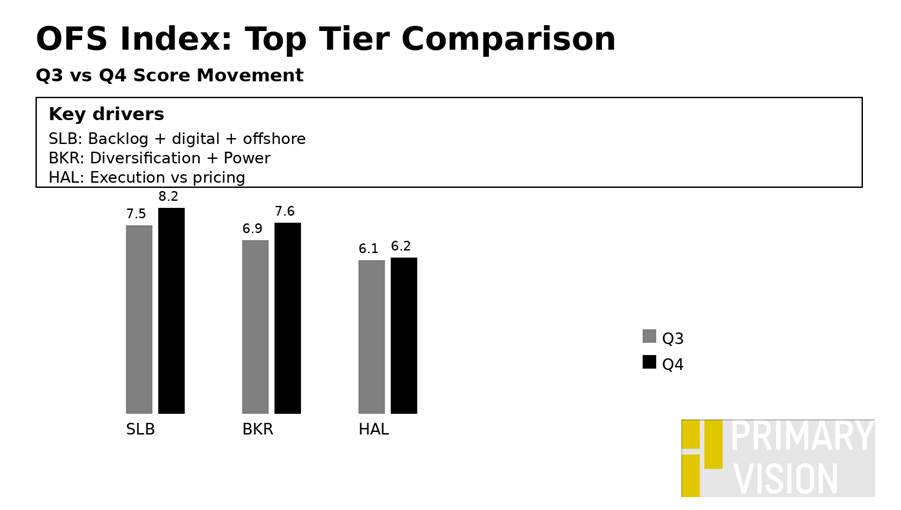
SLB, Baker Hughes, and Halliburton remain firmly positioned at the top of the index, with only modest changes in scores. SLB’s score improved in Q4, supported by stronger backlog visibility, digital integration, and expanding exposure to data center–linked growth. Baker Hughes also saw a score improvement, driven by its increasing diversification into LNG, power, and energy transition markets. Halliburton’s score remained broadly unchanged, as strong technology execution was offset by continued pricing pressure in North America.
The lack of meaningful movement at the top confirms that diversification, scale, and backlog visibility continue to anchor leadership. However, incremental improvements suggest that structural exposure is beginning to matter more at the margin.
Upper-mid tier: Visibility and execution driving upside
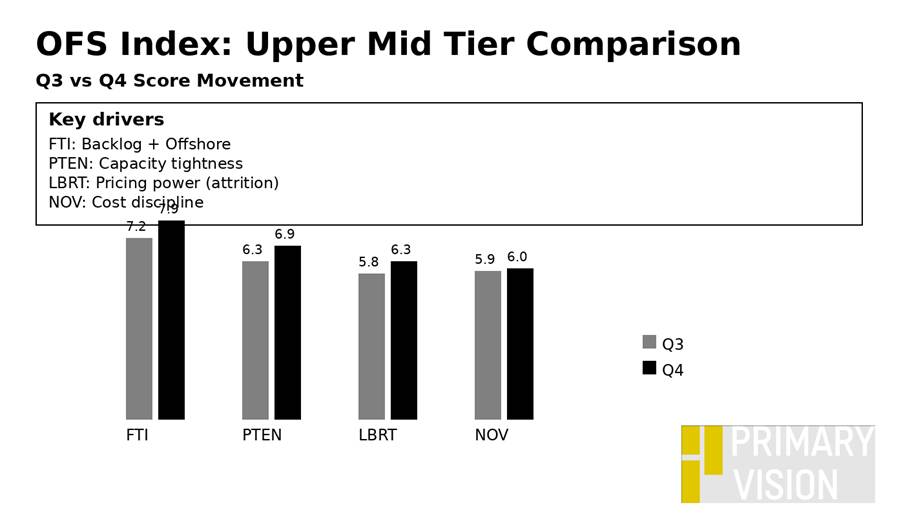
The most meaningful re-rating is occurring within the upper-mid tier, where execution and visibility are beginning to differentiate outcomes. TechnipFMC’s score improved in Q4, supported by sustained subsea inbound, 20K project wins, and strengthening backlog quality. Patterson-UTI also moved higher, reflecting tighter deployed horsepower and improving fleet quality, which signal tightening capacity conditions. Liberty saw a modest score improvement, driven by early signs of supply tightening through fleet attrition, even as pricing remains constrained.
NOV’s score remained broadly unchanged, as cost discipline and backlog support offset weaker U.S. activity. I think this tier clearly shows that visibility and execution are now driving upside, even in the absence of strong top-line growth.
Lower tier: Discipline beginning to drive differentiation
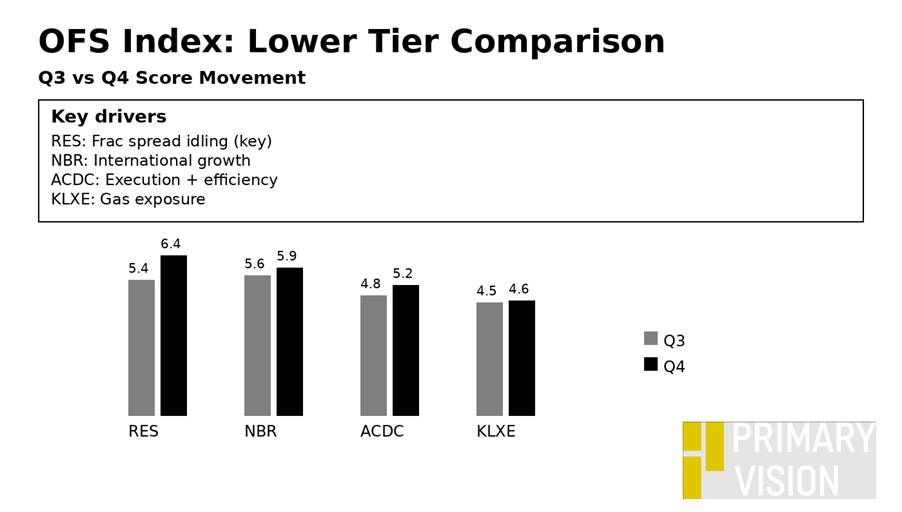
The lower tier shows more selective movement, with discipline emerging as a key differentiator. RPC saw the most significant score improvement in Q4, driven by the idling of a frac spread in October, which signals strong capital discipline and pricing protection.
Nabors’ score improved modestly, supported by international growth and improving rig deployment visibility. ProFrac’s (ACDC) score remained largely unchanged, as operational improvements were offset by continued macro softness. This suggests that while financial stability supports positioning, discipline and visibility are now required to drive meaningful re-rating.
Pressure pumpers: Early divergence emerging
Pressure pumpers remain clustered at the lower end of the index, but divergence is beginning to emerge more clearly. Patterson-UTI and RPC stand out as relative leaders, both seeing score improvements driven by tight capacity and disciplined fleet management. Liberty also improved modestly, reflecting supply-side tightening. ProPetro’s score remained broadly unchanged, as disciplined execution has yet to translate into tighter market conditions.
ACDC and KLXE saw limited movement, as macro headwinds continue to outweigh operational gains. I observed that the key shift here is that capacity quality and discipline are becoming more important than fleet count or activity levels, which marks an early signal of tightening market conditions.
Relative valuation
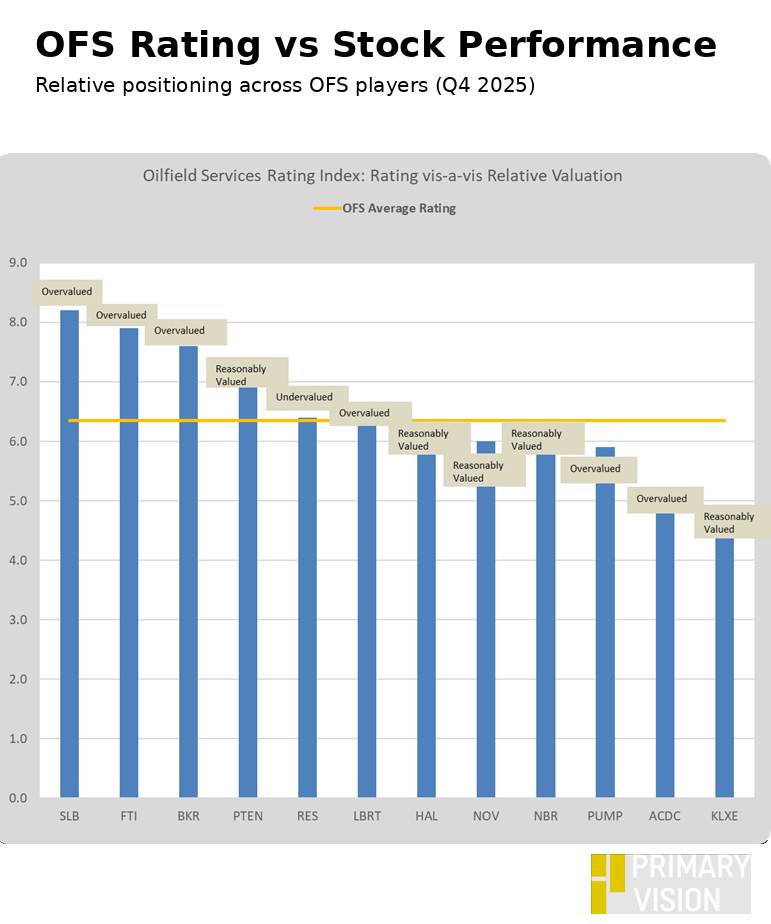
Based on EV/EBITDA multiples, RES appears relatively attractive, supported by improving positioning and low valuation levels. In contrast, SLB, FTI, BKR, LBRT, and PUMP trade at higher multiples, reflecting stronger structural exposure and visibility. The rest of the group remains broadly distributed across the valuation spectrum, with no clear outliers.
Takeaway
The Q4 update reinforces that the OFS sector remains stable, but increasingly selective. I think the most important change is that the market is beginning to reward positioning rather than performance.
Scores improved for companies with stronger backlog visibility, clearer diversification into LNG and power, and demonstrated capital discipline. Structural leaders such as Schlumberger and Baker Hughes continue to hold their positions, but are also beginning to benefit from these trends. However, the middle tier is now where most of the movement is occurring, as execution and visibility begin to differentiate outcomes.
At the same time, early signs of tightening within pressure pumping suggest that the next phase of the cycle may already be forming beneath current activity levels. Companies that combine discipline with structural exposure appear best positioned to benefit as the cycle evolves.
Tags:
Permission denied
Upgrade to Pro Today and get…
• This article — plus dozens more each month, all within our full Research Module
• Frac Hits — our National-Level Frac Spread Count and Frac Job Count, updated weekly
• Frac Operator Monitor — detailed FSC & FJC by operator
• And so much more, designed to help you track, forecast, and outperform


