

Articles
- BLOG / Articles / View
- Articles
Shale Efficiency Revisited: How Productivity and Activity Sensitivity Have Evolved
By Avik on February 13, 2026 in Articles
Shale Efficiency Revisited: How Productivity and Activity Sensitivity Have Evolved
U.S. shale production has remained resilient since 2022 despite wide swings in frac activity. The prevailing explanation has been efficiency—more output from fewer spreads. While directionally correct, that narrative is incomplete. Efficiency gains have not progressed uniformly across basins, nor have they translated consistently into lasting decoupling between production and activity.
To assess whether shale productivity has structurally improved, it is not enough to compare two endpoints. What matters is how efficiency and activity sensitivity evolved year by year—their sequencing, persistence, and reversals. This analysis therefore evaluates shale performance from 2022 through 2025 along two dimensions: production per frac spread as a measure of efficiency, and the correlation between production and frac spreads as a measure of activity dependence. Operator performance—using the basin leaders identified in our prior Public–Private analysis—is used to ground the industry-level trends.
Efficiency Trends: Improvement Exists, but the Paths Matter
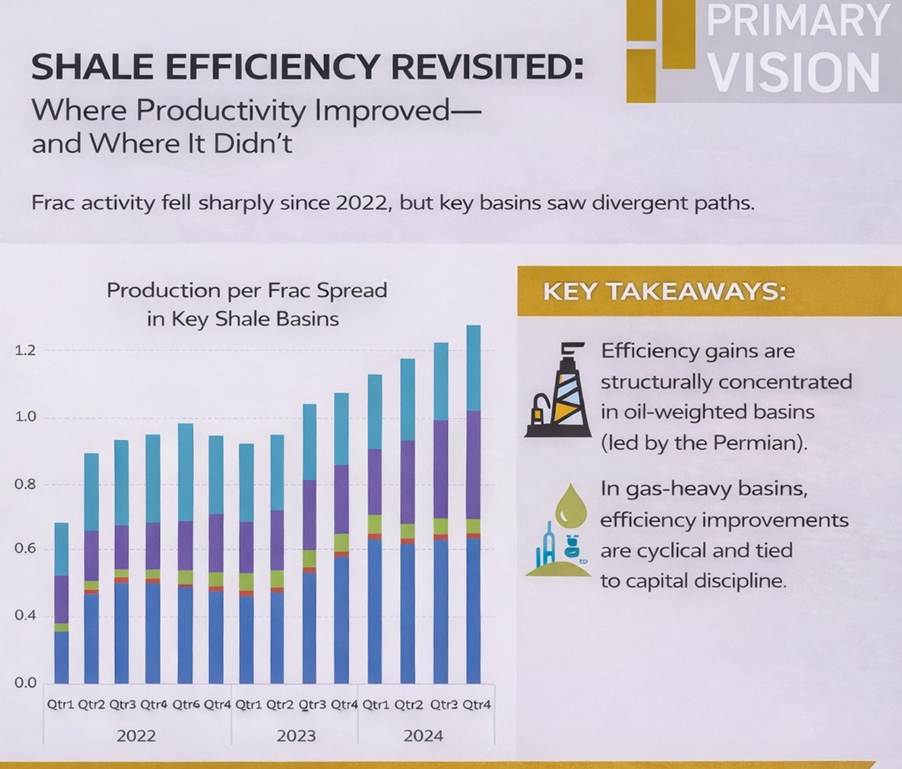
At an industry level, production per frac spread has increased since 2022, but the trajectory of improvement differs materially across basins. The Permian Basin shows the most consistent and durable progression, with efficiency rising steadily through 2025 and no meaningful reversal. This aligns with the operating profiles of large, scale-driven producers such as Exxon Mobil, Chevron, and Pioneer Natural Resources, whose long laterals, pad density, and inventory depth allow productivity gains to compound rather than reset.
Western Gulf basins also show rising efficiency, particularly after 2023, but the improvement accelerates sharply rather than building gradually. This pattern is consistent with the behavior of leading Eagle Ford operators such as EOG Resources and ConocoPhillips, where inventory sequencing and selective development have driven short-cycle gains. Gas-weighted basins display more volatile paths. The TX-LA-MS Salt Basin improves into 2024 before rolling over in 2025, reflecting the Haynesville exposure of operators such as Chesapeake Energy and Southwestern, while Appalachia posts modest gains consistent with the disciplined pacing seen at EQT and Range Resources. Williston remains broadly flat, mirroring the mature productivity profile of Bakken-focused operators like Continental Resources.
Activity Sensitivity: Correlation as a Moving Signal
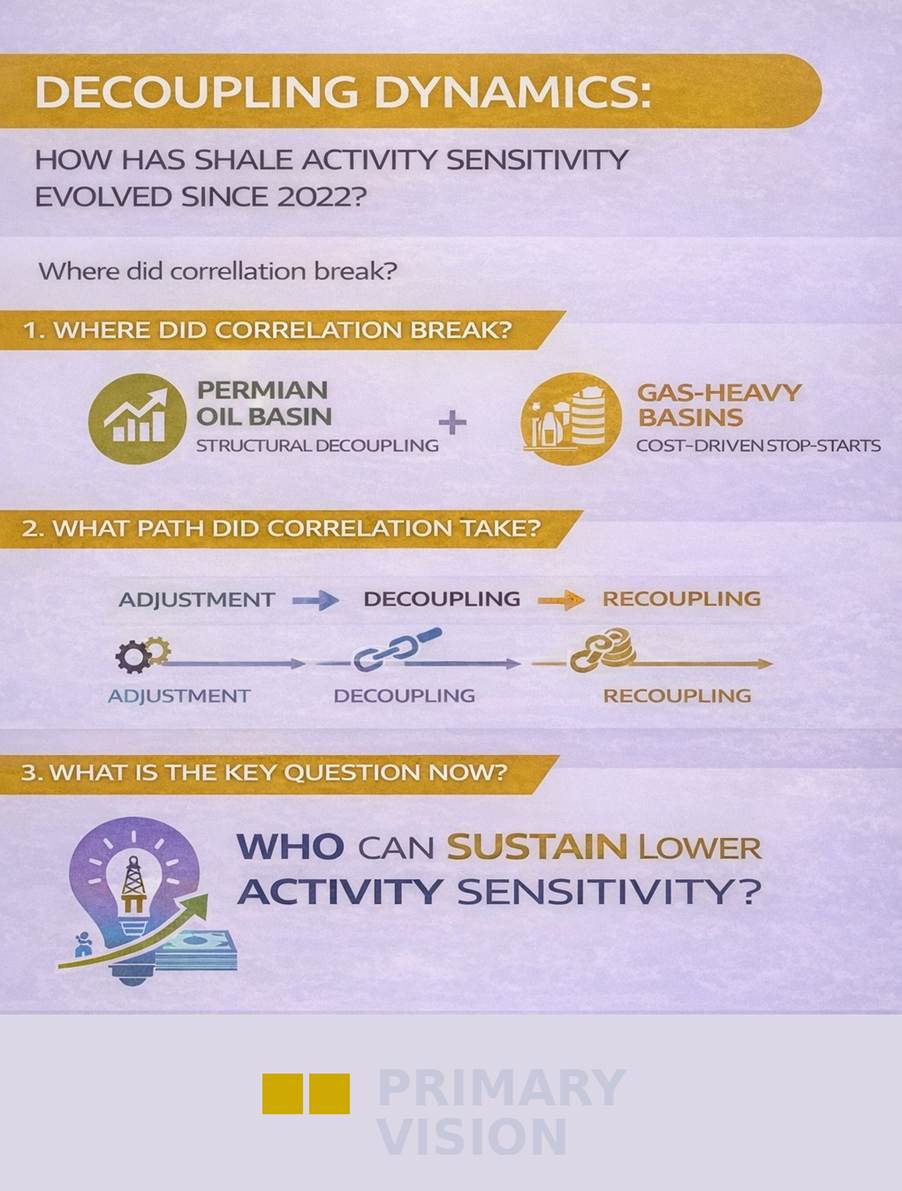
Efficiency alone does not determine whether productivity gains are structural. The more revealing signal is how closely production remains tied to frac activity—and how that relationship changes over time. Across basins, the correlation between production and frac spreads does not decline monotonically. Instead, it evolves through phases of adjustment, partial decoupling, and, in some cases, re-coupling.
The Permian shows the clearest progression. Correlation weakens from 2022 through 2024 and remains structurally lower in 2025, indicating that production growth has become less dependent on contemporaneous frac intensity. This is consistent with the operational behavior of large Permian producers that have sustained output growth despite tighter completion pacing. Western Gulf basins show a rapid decline in correlation, even turning negative before stabilizing, reflecting an inventory drawdown rather than permanent decoupling. By contrast, Appalachia remains highly correlated throughout the period, while the TX-LA-MS Salt Basin’s correlation break in 2025 coincides with an efficiency reversal, pointing to capital restraint rather than durable productivity gains.
Efficiency and Correlation Together: A Trajectory Test
Viewed together, efficiency levels and correlation behavior provide a clearer diagnostic than either metric alone. Structural productivity improvement requires both sustained efficiency gains and persistently lower activity sensitivity. One without the other is insufficient. Temporary correlation breaks—particularly those driven by capital discipline—do not, on their own, signal durable efficiency.
By this standard, the Permian stands apart. Efficiency improves steadily, and correlation remains lower after periods of adjustment, reflecting a basin where leading operators have embedded productivity into development systems. Western Gulf basins show partial success, where efficiency gains are real but more closely tied to inventory management. Gas-weighted basins fail the persistence test: efficiency gains flatten or reverse, and correlation breaks prove temporary. This trajectory-based framework explains why endpoint comparisons can mislead and why the path of change matters more than the destination.
Operator Evidence: Grounding the Industry Signal
Operator-level performance reinforces the basin-level conclusions rather than contradicting them. In oil-weighted basins, the largest producers have sustained production growth with relatively stable frac intensity and controlled cost structures, validating the presence of structural efficiency. These outcomes reflect scale, inventory depth, and disciplined execution rather than aggressive activity expansion.
In gas-heavy basins, even the most disciplined operators remain tightly linked to activity levels. Where efficiency gains appeared strongest, they were often accompanied by inventory drawdown and reversed as activity normalized. While dispersion within basins exists, it does not overturn the broader structural patterns observed at the industry level. Operators confirm basin regimes; they do not redefine them.
The 2025 Price Backdrop Mattered
Crude oil prices remained range-bound but supportive, allowing oil-weighted basins to sustain development and preserve completion cadence. That stability helped operators embed operational gains and maintain production momentum. Natural gas prices, by contrast, weakened sharply in 2025 amid oversupply. Gas-focused operators responded by curtailing activity. As a result, apparent efficiency gains in gas-heavy basins increasingly reflected activity pullbacks rather than lasting productivity improvement.
Bottom Line
Shale efficiency has improved since 2022, but structural productivity gains remain uneven and highly basin-specific. The distinction lies not in where basins ended up, but in how efficiency and activity sensitivity evolved over time. Sustained efficiency gains coupled with persistent correlation decay remain concentrated in oil-weighted basins led by scale-driven operators.
For investors, the key question is no longer whether shale can temporarily produce more with fewer frac spreads, but which basins—and which operators—can sustain that advantage across cycles. That distinction will increasingly separate durable outperformers from those merely riding favorable timing.
Tags:
Permission denied
Upgrade to Pro Today and get…
• This article — plus dozens more each month, all within our full Research Module
• Frac Hits — our National-Level Frac Spread Count and Frac Job Count, updated weekly
• Frac Operator Monitor — detailed FSC & FJC by operator
• And so much more, designed to help you track, forecast, and outperform


