Leadership Is Consolidating Among Established Operators
The first article in this series demonstrated that U.S. completion activity is becoming increasingly concentrated within a shrinking number of core shale counties. Now, we look at it from the operators' perspective based on the top 20 counties. The operator landscape is becoming more concentrated, although the shift extends beyond the industry's five largest companies.
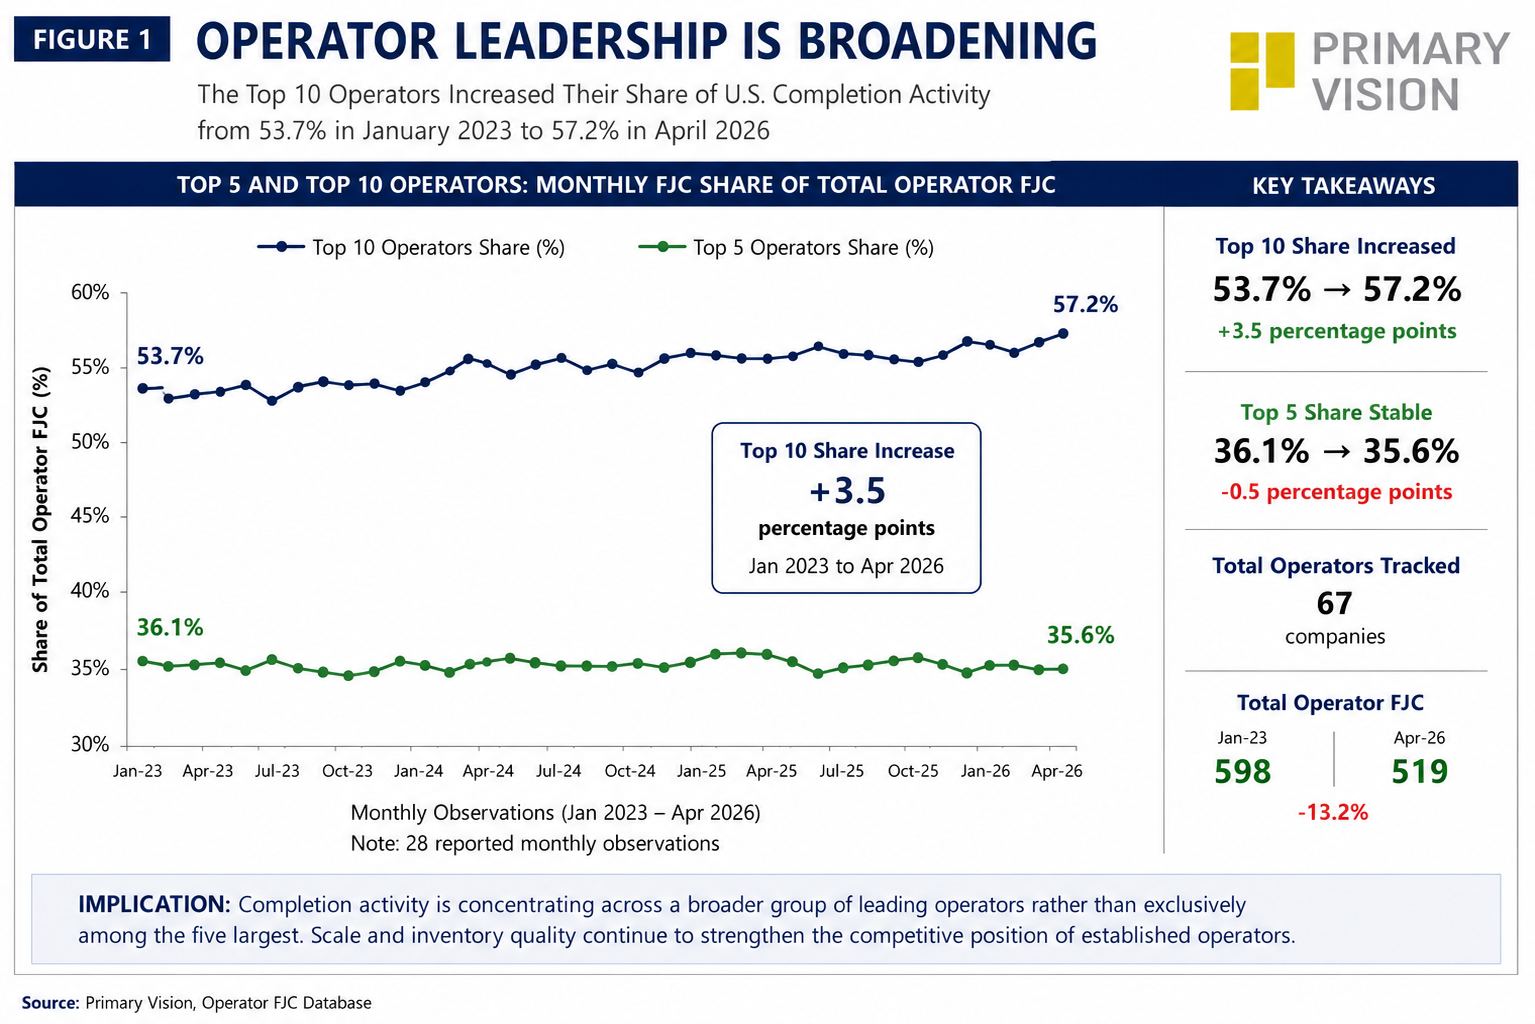
While the Top 5 operators maintained a relatively stable share of completion activity, declining marginally from 36.1% to 35.6%, the Top 10 expanded their share from 53.7% to 57.2%, a gain of 3.5 percentage points over the study period.
The data suggests that competitive leadership is broadening across a larger group of established operators. Consolidation has strengthened this trend by combining contiguous acreage positions and concentrating development. At the same time, capital discipline has encouraged operators to focus investment on their most productive inventory rather than pursuing production growth.
There Is No Longer a Single Path to Leadership
Although leadership is becoming more concentrated, the strategies used to achieve it have become increasingly diverse.
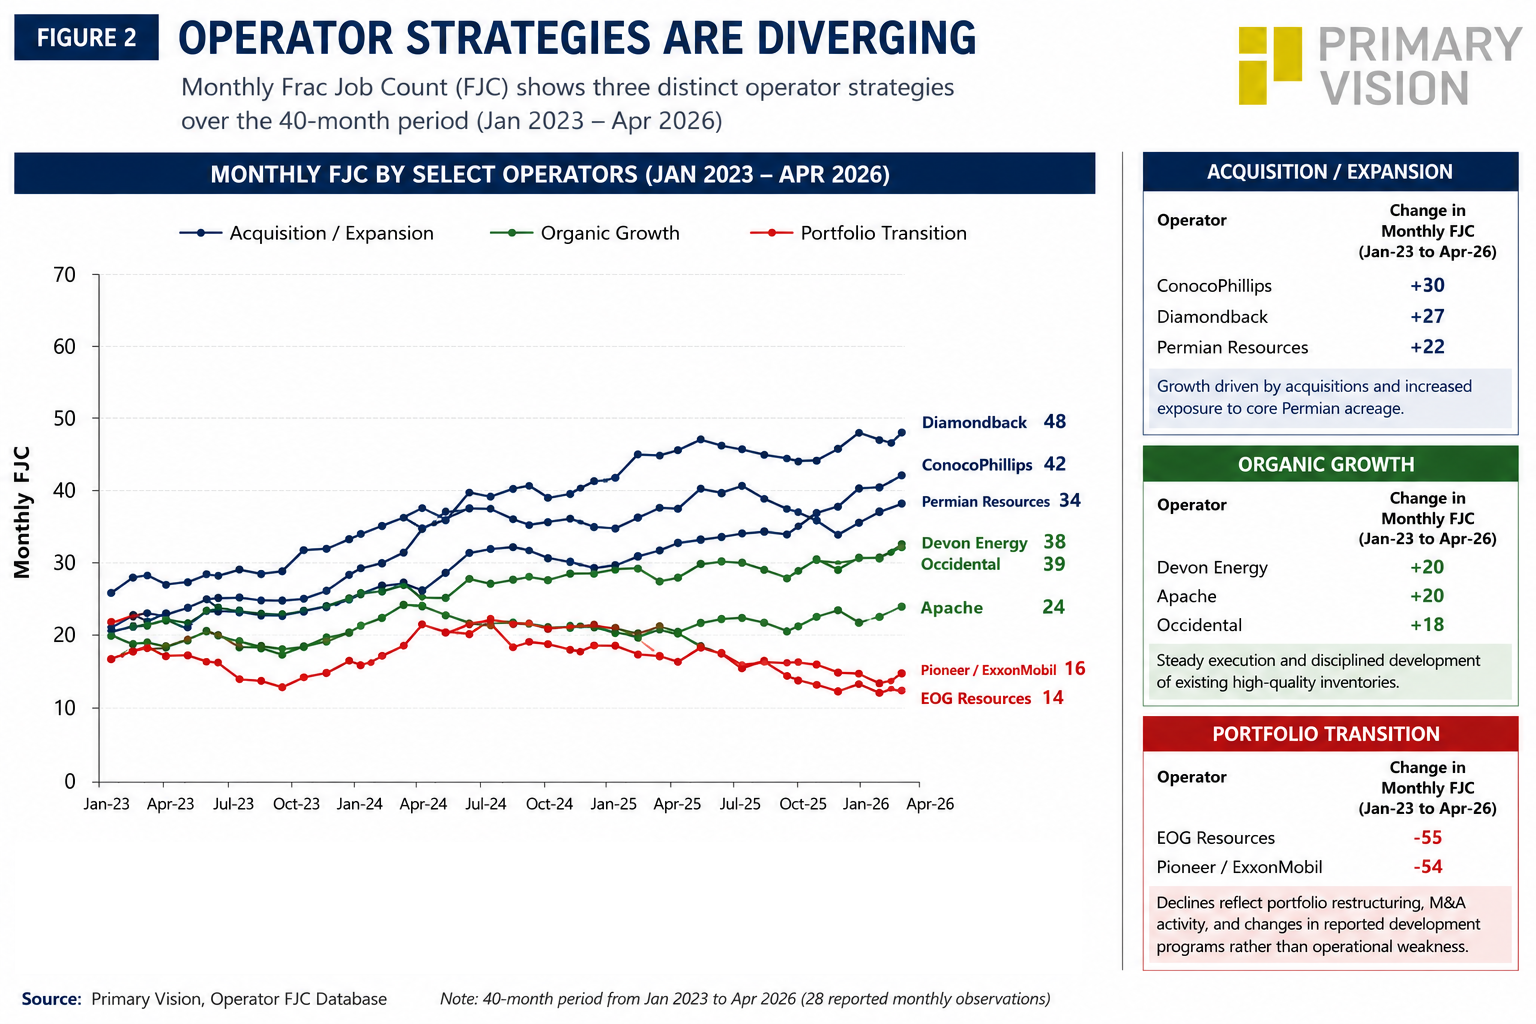
Monthly Frac Job Count highlights three distinct operator strategies. Diamondback Energy, ConocoPhillips, and Permian Resources recorded the strongest growth, supported by acquisitions and expanding exposure to core Permian acreage. Devon Energy, APA, and Occidental delivered steady organic growth through disciplined development of existing inventories.
In contrast, EOG Resources and Pioneer Natural Resources (now part of ExxonMobil) saw declining completion activity as portfolio restructuring, M&A, and shifting development priorities reduced their standalone Frac Job Count. The diverging trends demonstrate that corporate strategy has become an increasingly important driver of completion activity across U.S. shale.
Execution Is Emerging as the New Competitive Advantage
The capital allocation analysis explains why operator performance is beginning to diverge.
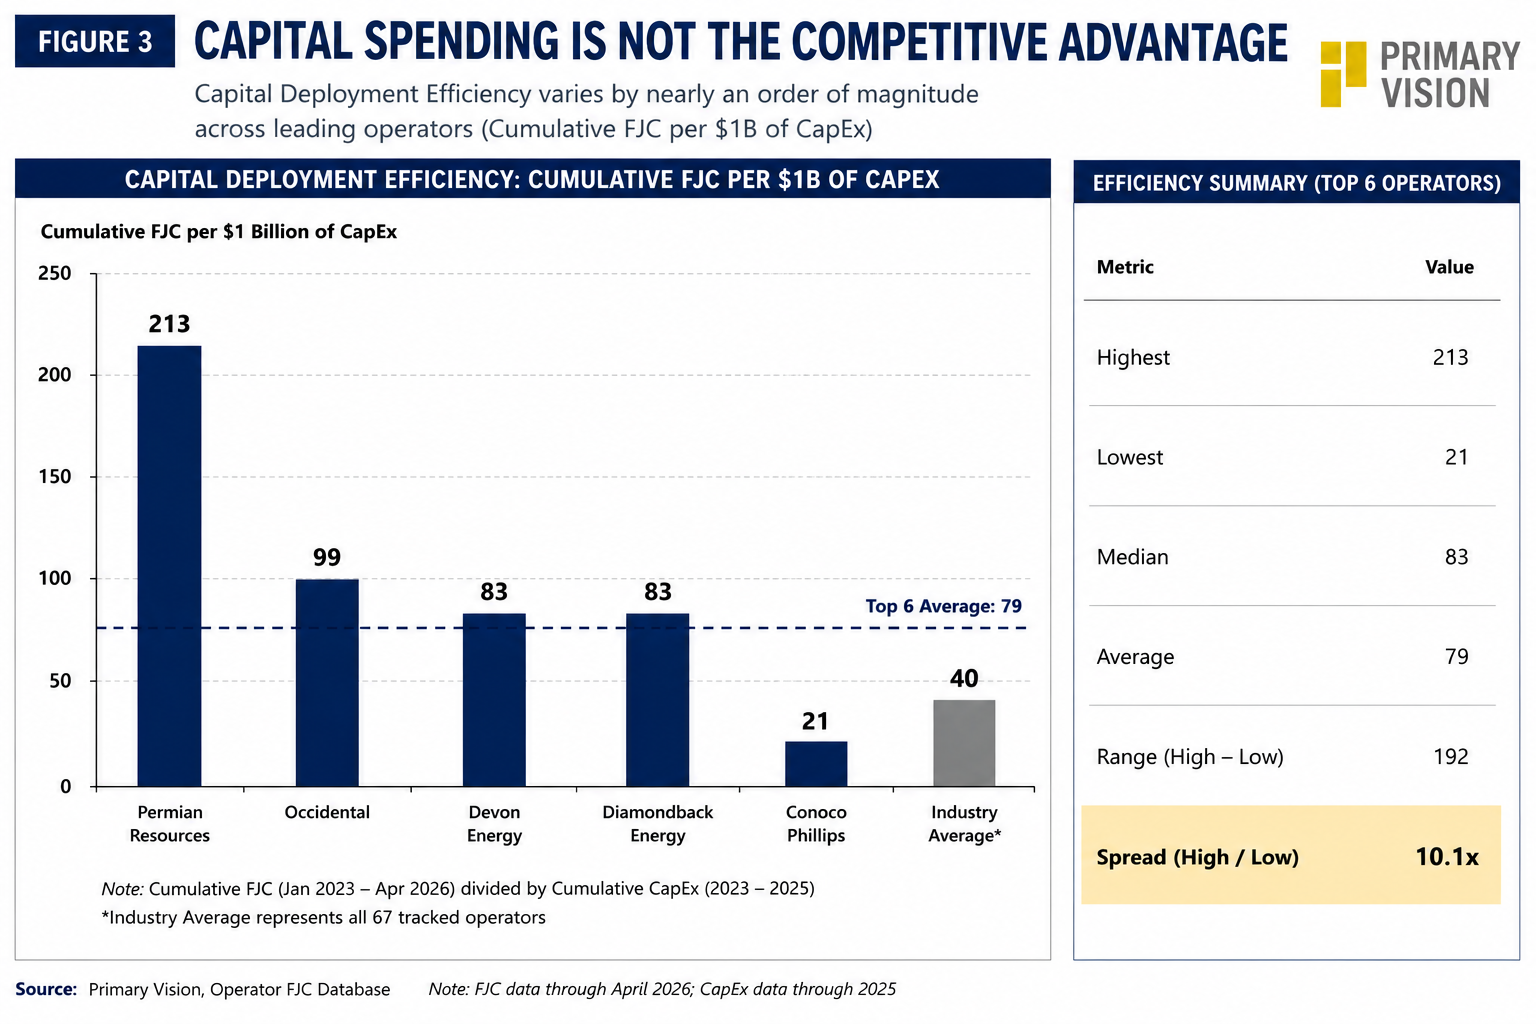
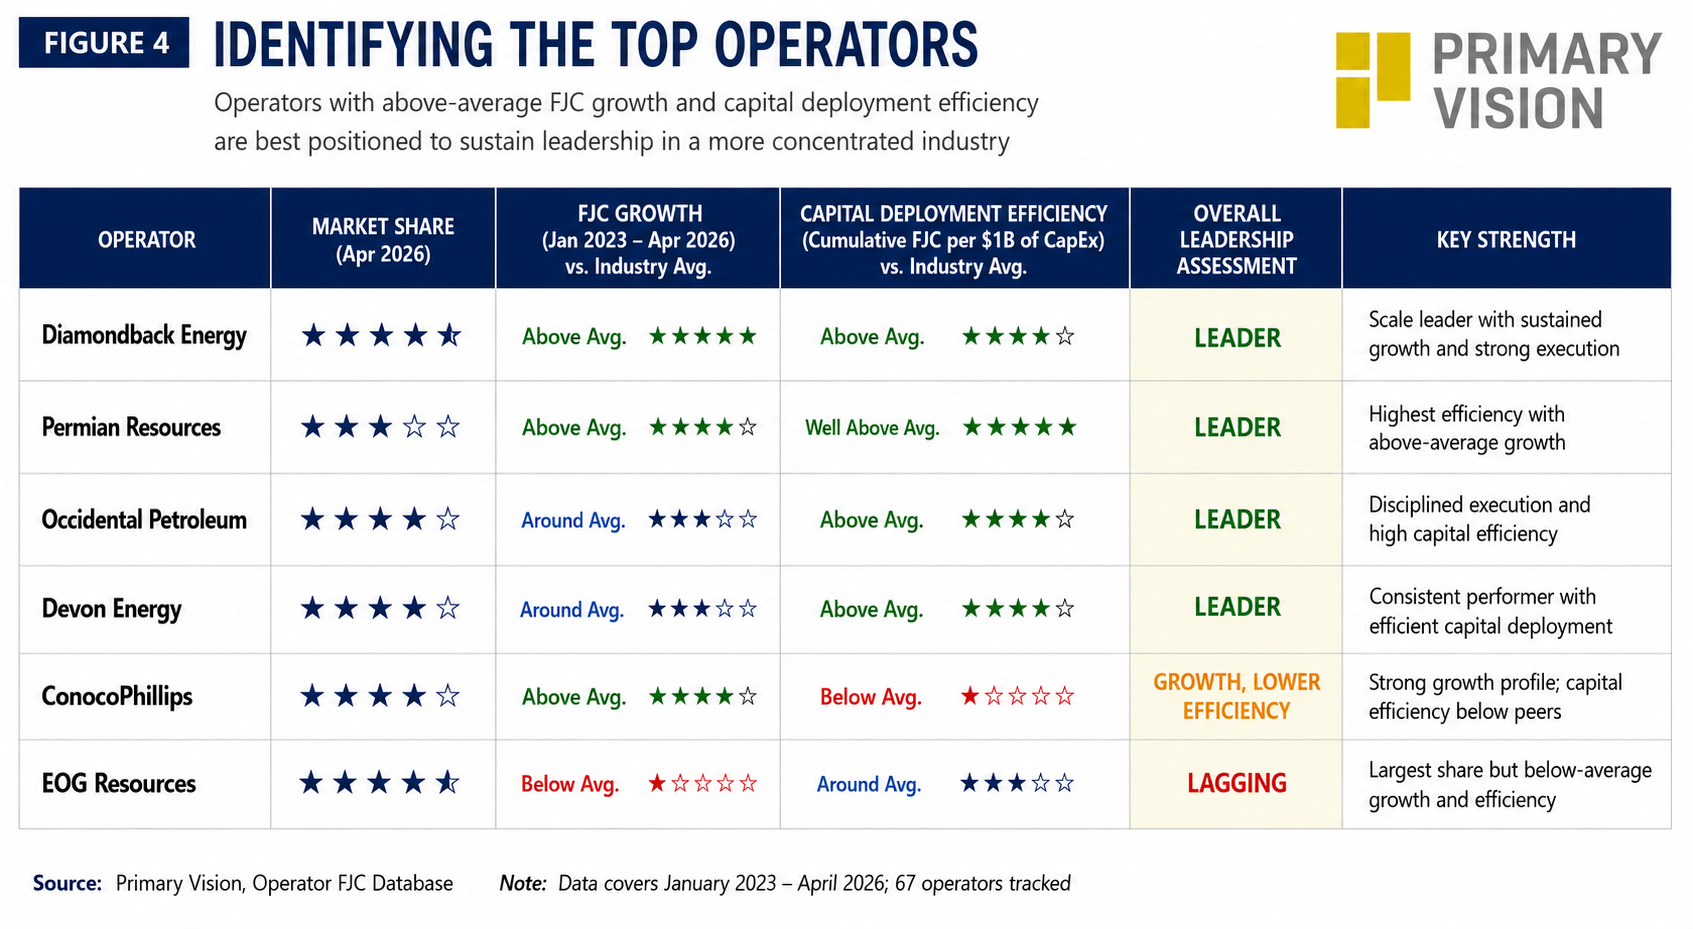
To compare across the operators, we are defining Capital Deployment Efficiency as cumulative FJC per $1 billion of capex. So, for each US$1 billion capex invested, Permian Resources converted its capital program into roughly 213 completed frac jobs in this period. The ratio differs by approximately tenfold across the leading operators.
The differences become clearer when capital allocation is compared with operational activity. Occidental and Devon Energy also converted capital into completion activity more efficiently than the peer average. Diamondback Energy maintained one of the industry's largest completion programs but with lower capital intensity, while ConocoPhillips ranked last under this measure, illustrating how a diversified global investment portfolio can reduce completion activity relative to total upstream capital spending.
Investor Takeaway
Primary Vision's analysis suggests that Diamondback and Permian Resources currently exhibit the strongest combination of operational momentum and capital deployment efficiency among leading U.S. shale operators. Occidental and Devon Energy remain high-quality execution stories, supported by disciplined capital allocation and consistently strong completion activity.
For investors, the message is straightforward: operator quality should increasingly be evaluated through the combination of market share, completion activity growth, and capital deployment efficiency—not capital spending alone. Companies that lead across all three metrics are best positioned to strengthen their competitive advantage as the U.S. shale industry continues to consolidate.
Next in the series, we will look into the paradigm from the pressure pumpers’ perspective.
Upgrade to Pro Today and get…
• This article — plus dozens more each month, all within our full Research Module
• Frac Hits — our National-Level Frac Spread Count and Frac Job Count, updated weekly
• Frac Operator Monitor — detailed FSC & FJC by operator
• And so much more, designed to help you track, forecast, and outperform