

Articles
- BLOG / Articles / View
- Articles
What Frac Data Says (Doesn’t Say) About Operator Power
By Avik on February 6, 2026 in Articles
Shale Activity Is Splitting — But Control Isn’t
Frac job data across major U.S. shale basins increasingly features private operators. Names such as Mewbourne, Ascent, Phoenix, and Rosewood appear prominently in 2025 completion rankings, sometimes close to large public peers. That visibility has fueled the perception that private operators are gaining ground while publics are pulling back.
But frac activity reflects short-term behavior, not structural power. To evaluate whether a real shift is underway, activity must be assessed alongside production scale, inventory depth, and strategic positioning. Frac jobs show who is completing wells today; they do not show who controls basin supply or who has the flexibility to defer. By market power, we mean the ability to influence basin-level outcomes through scale, inventory depth, and financial flexibility. The real question is not who is more active, but who has more optionality.
What Frac Job Counts Actually Measure
Frac jobs capture short-cycle operational decisions. They show who is completing wells today. They do not show who controls inventory, who dictates basin behavior, or who can afford to defer activity. This distinction matters. Smaller operators often must maintain completion intensity to preserve asset value. Larger operators can pace development without losing strategic relevance. Activity reflects urgency. Optionality reflects power.
Permian Basin: Activity Urgency Versus Structural Control
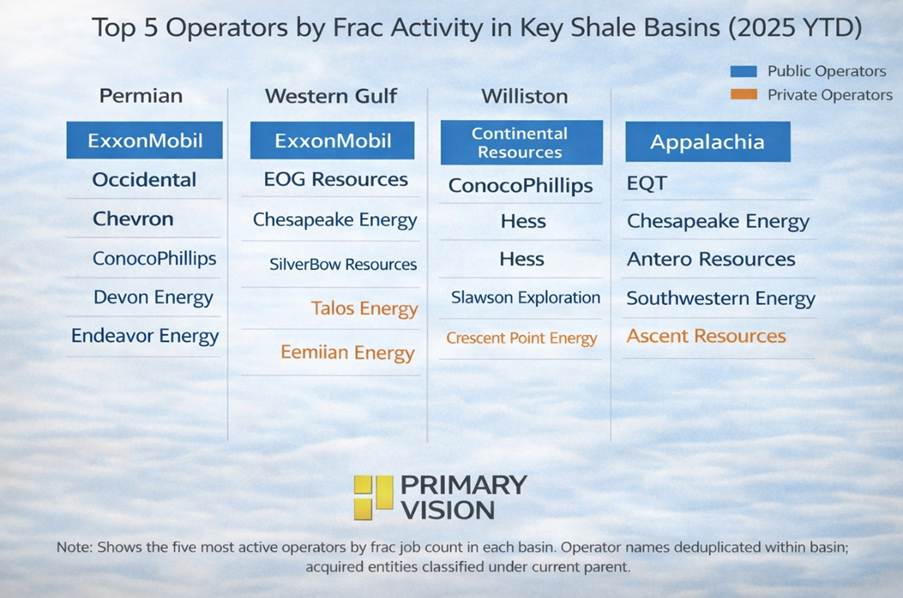
Among leading Permian operators, 2025 frac data shows Exxon (Pioneer + XTO) running 599 jobs, EOG at 362, and Mewbourne at 252. On activity screens, this makes Mewbourne appear increasingly competitive. Production scale provides context. Exxon’s Permian production remains structurally dominant. EOG continues to operate at materially larger scale. Mewbourne is meaningful, but not comparable in basin influence.
The interpretation is straightforward. Mewbourne’s higher completion intensity reflects the need to sustain momentum. Exxon and EOG’s lower relative intensity reflects strategic pacing. Frac share here signals urgency, not share capture.
Appalachian Basin: A Coordination Issue
Frac activity in Appalachia shows EQT (319 jobs), Expand Energy (248), and Ascent (211) all running active programs. The numbers appear competitive on the surface. But the basin behaves less like a competitive battlefield and more like a coordination system.
Each operator is managing price exposure, capital discipline, and midstream constraints. Activity changes reflect portfolio decisions, not displacement. Ascent does run slightly hotter than its production weight implies. But the magnitude is modest. The basin structure remains intact.
Williston Basin: A Clear Divergence
The Williston data most clearly illustrates the broader dynamic. Phoenix ran 70 frac jobs in 2025, accounting for roughly a quarter of completions among the top operators. But it represents only a small fraction of production scale relative to Chevron (Hess) and Chord.
The elevated activity is not evidence of disruption. It is evidence of constraint. Phoenix must remain active to sustain relevance. Chevron and Chord do not. This is not market share transfer. It is a behavioral asymmetry.
Western Gulf: Two tiers remain intact
In the Eagle Ford, EOG and Devon continue to anchor the basin structurally. Rosewood appears in frac data, but its production footprint remains small.
The pattern matches other basins. Smaller operators often appear aggressive in completions. But production weight — and therefore strategic influence — remains concentrated among a small number of large operators.
What The Data Actually Shows
Across all four basins, the same pattern repeats. Private operators generally run more completions relative to their scale. Large public operators generally run fewer completions relative to their scale.
That does not imply privates are winning. It implies the two groups are optimizing for different objectives. Privates optimize for near-term value realization and must stay operationally active. Public operators optimize for durability, inventory management, and long-cycle returns. They can afford to defer.
Who Retains More Production Efficiency?
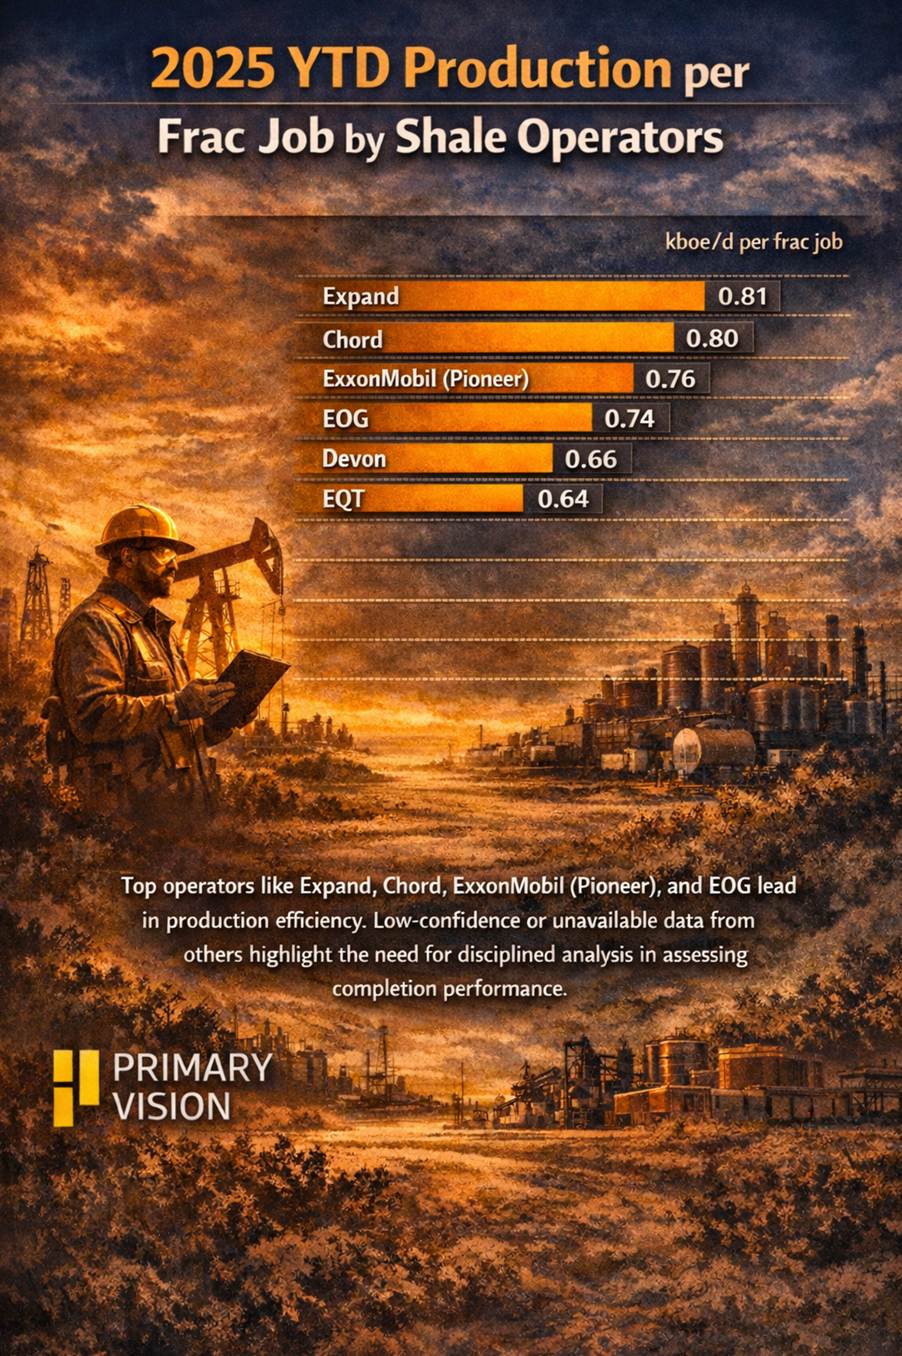
Productivity per frac job shows meaningful dispersion across operators. Expand, Chord, ExxonMobil (Pioneer), and EOG consistently convert completions into higher production, signaling stronger execution rather than just scale.
Several operators drop out due to low confidence or missing data, underscoring the limits of disclosure and the need to treat efficiency comparisons with discipline. The implication is consistent with the article’s thesis: differentiation in shale increasingly comes from execution quality, not activity volume.
Price context
This analysis assumes a mid-cycle environment of roughly $65–$80 oil and $2.50–$3.50 gas. At these levels, top-tier inventory remains economic. Marginal locations require discipline. Service costs still matter. Capital efficiency matters. In this environment, scale, inventory depth, and financial flexibility matter more than raw completion intensity. That structurally favors the largest operators.
Stock Price Context
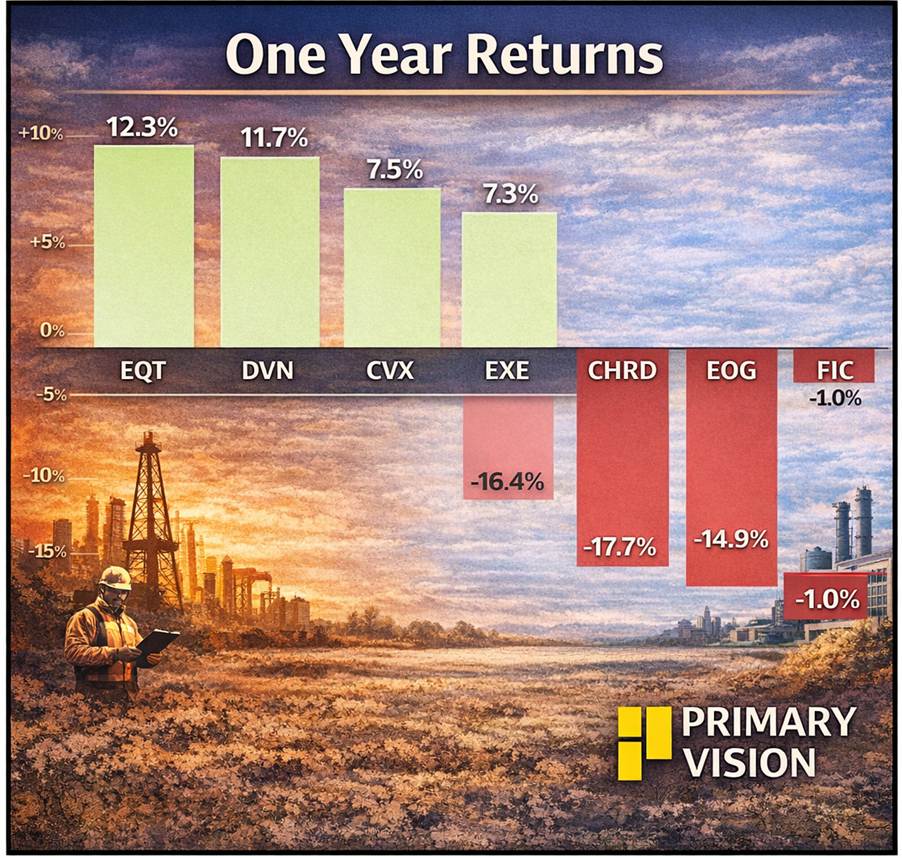
Equity performance over the past year does not support the idea that higher frac activity equates to stronger positioning. Operators running more aggressive programs have not consistently outperformed. Several companies running more restrained programs have held up better. Markets are reinforcing the same signal as the operational data. Investors are rewarding balance sheet strength, durability, and discipline — not raw volume growth.
Takeaway
Private operators are visibly more active in the 2025 frac data. Large public operators are deliberately more restrained. That pattern is being misread. High activity often reflects constraint. Lower activity often reflects optionality. The data does not show a transfer of power from public to private. It shows that strategic flexibility remains concentrated with the largest operators. And in today’s shale environment, flexibility is still the decisive advantage..
Methodology Note
This analysis does not attempt to estimate total basin market share. It focuses on the most active operators in each basin to compare completion intensity with production weight within a defined peer group. Frac job counts reflect 2025 YTD activity for leading operators. Production figures use 2024 basin-level estimates derived from company disclosures and third-party synthesis where necessary. The objective is to evaluate behavioral differences between large public operators and private operators operating within the same tier, rather than to model total basin outcomes.
Tags:
Permission denied
Upgrade to Pro Today and get…
• This article — plus dozens more each month, all within our full Research Module
• Frac Hits — our National-Level Frac Spread Count and Frac Job Count, updated weekly
• Frac Operator Monitor — detailed FSC & FJC by operator
• And so much more, designed to help you track, forecast, and outperform


