

Articles
FREE READ: Shale Resilience and the Question of a Structural Oil Glut
By Osama on February 12, 2026 in Free Articles

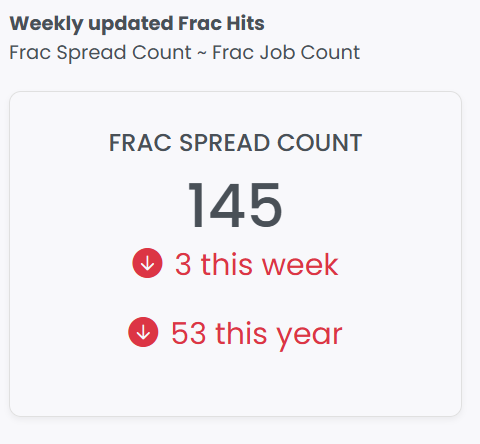
Primary Vision’s Frac Spread Count is sitting at 145, down 53 year-on-year, while the U.S. rig count stands at 551, lower by 35 rigs versus last year. Under normal shale-cycle dynamics, that combination would already be translating into declining output. Yet U.S. crude production is not falling. The EIA shows U.S. production averaging 13.60 mb/d in 2025, holding at 13.60 mb/d in 2026, and only easing modestly to 13.32 mb/d in 2027. Lower 48 volumes peak near 11.44 mb/d before gradually drifting lower, while the Permian holds around 6.6–6.7 mb/d through 2026.
I have covered this topic of Peak shale in this week's Monday Macro View and used data points from Primary Vision's EFRACS platform to compare the number of average jobs, as indicated by Frac Job Count, being performed back in 2019 and then in 2025. We see a 25%-30% decline yet production jumped 10%-12% in these years. Once again reinforcing the narrative that we have been trying to share. Shale is doing an amazing job in trying to offset declining rates and hold production steady. It even registered an increase!!!
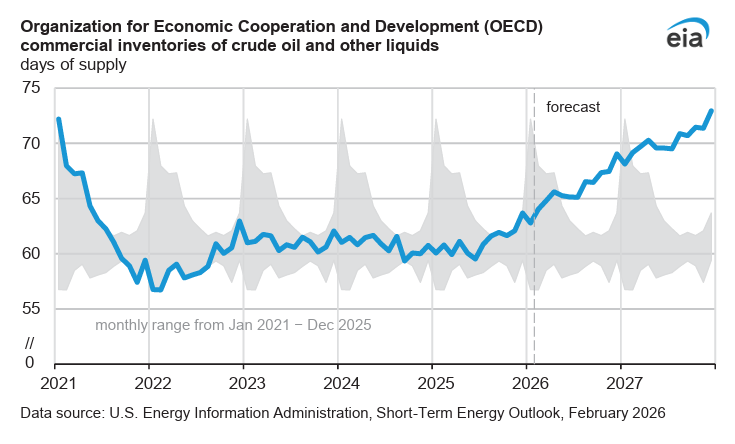
Now, I'd like to talk a bit about the recently released report by EIA. It projects global inventory builds averaging 2.7 mb/d in 2025, accelerating to 3.1 mb/d in 2026, and remaining elevated at 2.7 mb/d in 2027. Demand growth runs 1.2 mb/d in 2026 and 1.3 mb/d in 2027, largely from non-OECD Asia. China adds roughly 0.2 mb/d annually, India about 0.3 mb/d. That math is straightforward: supply growth outpaces demand growth by a wide margin. The result is structural stock accumulation.
Now many analysts, including myself, are looking at this supply glut narrative in askance. We know that non-OPEC supply is strong. Recent increase in seaborne oil exports by Canada and production upticks coming from Brazil, Argentina and Guyana are an example of this. We also know that U.S. oil supply sits at record high - as described above. Demand has been lukewarm. The other point to consider when looking at supply glut is to determine how much of it is due to increased oil supply and how much of it is because of bottlenecks created as a result of sanctions or blockages for dark fleet. Many tankers have been reported to throng at Gulf of Oman finding entry into India - just one example. So there may not be a supply glut - at least in such volumes as stressed by the above report.
Another interesting dimension of this can be seen in Canada which is facing a crude supply glut after major pipeline expansions, especially the Trans Mountain increase from 300,000 to 890,000 b/d, unlocked higher oil sands production that has now reached around 6.1 mb/d. Output growth has outpaced demand and pipeline capacity, widening Western Canadian Select discounts to over $15 per barrel versus WTI and pushing the market into contango. Rising inventories, pipeline rationing, weaker arbitrage to the U.S. Gulf Coast, and renewed competition from Venezuelan and Russian crude are now squeezing profitability across higher-cost producers.
Tags:


