

Articles
- BLOG / Articles / View
- Articles
Monday Macro View: For U.S. shale, 2025 was the year of efficiency
By Osama on December 29, 2025 in Market Sentiment
We have heard many opinions and read extensive research regarding one of the most important and impressive oil growth stories of this decade, i.e., U.S. shale. Every Monday, through the Macro View(s), I have tried to bring our readers an unbiased and data-driven perspective, especially vis-à-vis the latest developments in the U.S. oil industry in particular and global markets in general. For this purpose, I have continued to use the Frac Spread Count, while also focusing significantly on Frac Job Count, as it tells us the number of jobs being performed. If you have followed these research articles regularly, a theme emerges: we learned that there is more to oil production trends than just oil prices.
What are the other factors? We saw that capital discipline shaped industry behavior. Along with that, the most important factor determining the trajectory of U.S. oil production was the use of technology—what is now being termed Shale 4.0 (which I also wrote about in detail). Another lesson was the use and deployment of horsepower, a topic that we thoroughly covered in our last Third Party Opinion webinar with Bloomberg. Continued frac’ing jobs, which are now getting bigger and longer, also served as a better indicator for oil production in the shale patch than simply counting the number of rigs. Finally, the use of AI and the resulting efficiency gains—some of which I personally witnessed during ADIPEC or learned about through discussions with various industry leaders—have given shale the superpower to extract more oil from the ground than was previously imagined.
.png)
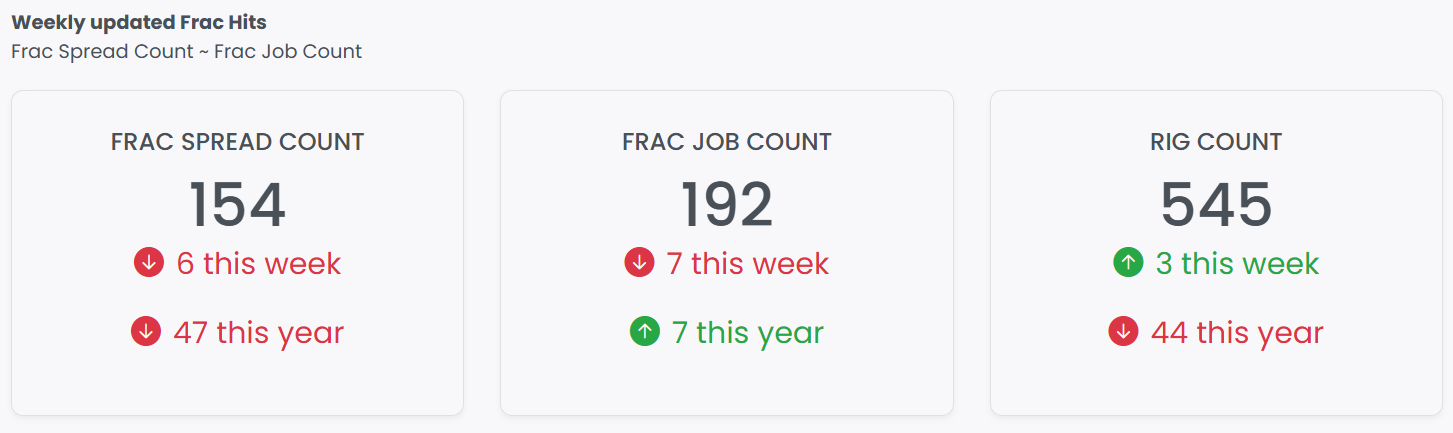
For my last MMV of 2025, I will once again start with the latest FSC and FJC. The Frac Spread Count came in at 154, falling by 6 on a week-over-week basis, while the Frac Job Count was 192 after a drop of 7 this week. Now let’s break it down.
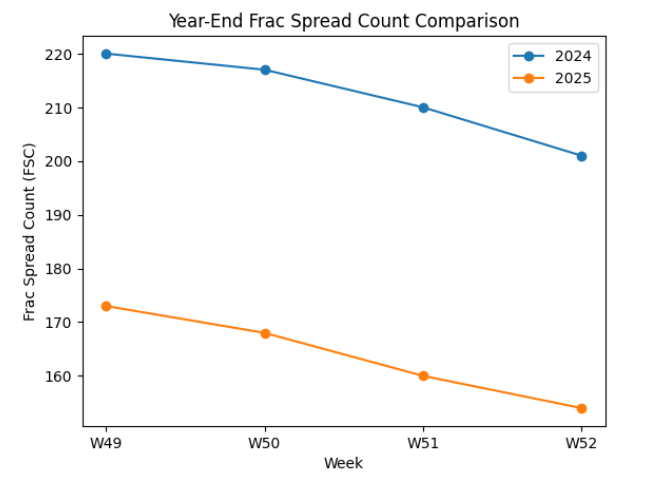
In December 2024, the U.S. Frac Spread Count (FSC) declined from 220 to 201, an 8.6% month-over-month drop, while in December 2025 FSC fell from 173 to 154, representing a decline of about 11.0%. Although both years recorded meaningful December pullbacks, the difference between the two percentage declines is modest, indicating a broadly similar magnitude rather than a sharp deterioration in activity. The recurrence of this pattern across consecutive years supports the interpretation that December weakness in FSC is largely seasonal, as already evident in the 2024 data. At the same time, U.S. crude oil production continued to rise, increasing from roughly 13.2 million barrels per day in December 2024 to about 13.5 million barrels per day by September 2025, a gain of approximately 2.3%. This combination of declining frac activity alongside rising output brings the Frac Job Count into discussion.
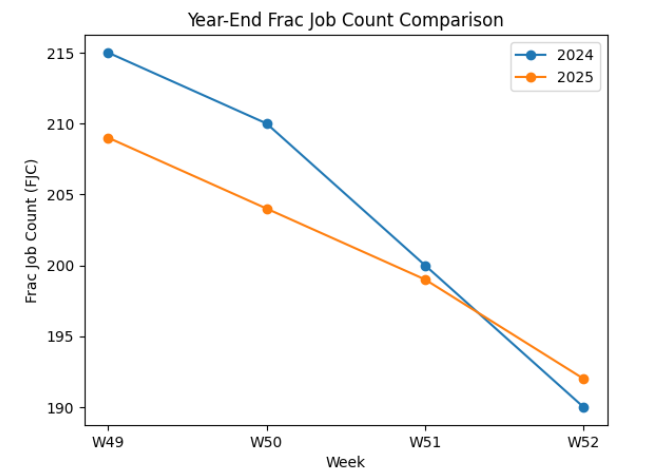
In late 2024, Frac Job Count (FJC) declined from 215 in week 49 to 190 by week 52, a drop of about 11.6%. In 2025, FJC fell from 209 to 192 over the same period, a smaller decline of roughly 8.1%, showing that the December drop this year was clearly less than last year. In both years, the fall in FJC was also smaller than the decline in frac spread count (FSC), especially in 2025 when FSC fell by about 11%. Despite the seasonal slowdown, FJC in late 2025 remained about seven jobs higher than at the same point in 2024. This helps explain why U.S. oil output can rise even as FSC falls, as a similar number of frac jobs are being completed with fewer active spreads.
Looking forward, it is important to focus on global oil inventories—especially oil on water and Chinese imports—as these two factors are likely to have a meaningful impact on prices. We will also be monitoring monthly exports and production by OPEC+ members. The geopolitical landscape, including but not limited to the Russia-Ukraine peace plan and overall tensions in the Middle East, will be other critical factors to watch. All of this impacts oil prices, which in turn affects U.S. shale as well—albeit with a lag, and with a linkage that has weakened somewhat due to the efficiency-enhancing factors discussed above. I will be publishing another article outlining the list of factors I will be closely tracking to determine the direction of oil markets. It is important to differentiate between noise and signal.
As this marks the final MMV of 2025, the key takeaway remains consistent with the themes we have discussed throughout the year. Headline activity indicators like rig counts or frac spreads alone no longer tell the full story. Technology, efficiency gains, longer and larger frac jobs, and disciplined capital allocation continue to reshape how U.S. shale responds to price signals. Seasonal slowdowns should be viewed in context, not in isolation. As we head into 2026, separating short-term noise from structural signals will be critical in understanding the true direction of oil markets and U.S. shale production.
Tags:
Permission denied
Upgrade to Pro Today and get…
• This article — plus dozens more each month, all within our full Research Module
• Frac Hits — our National-Level Frac Spread Count and Frac Job Count, updated weekly
• Frac Operator Monitor — detailed FSC & FJC by operator
• And so much more, designed to help you track, forecast, and outperform


