Breakeven Series: Why Price Alone Does Not Explain Shale Activity
By
Osama
on January 27, 2026
in
Market Sentiment
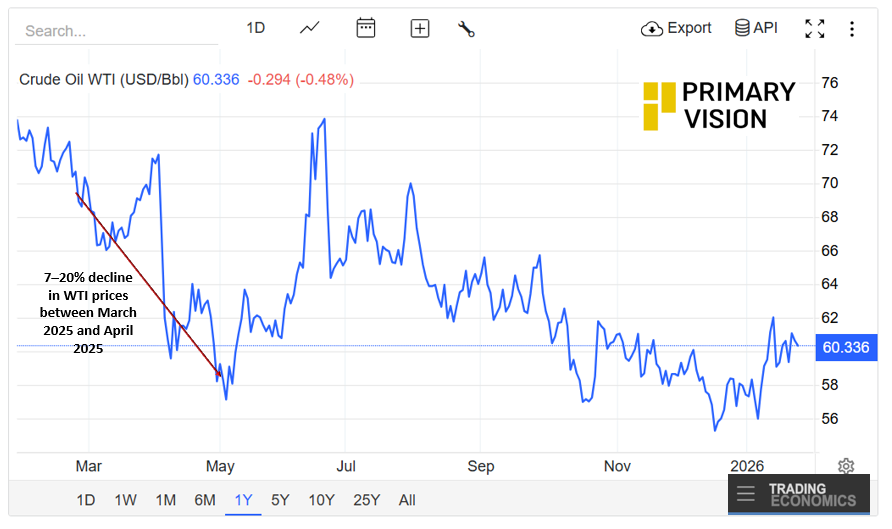
This article expands on our previous series where we breakdown breakevens in 4 layers and then stress test them against real companies and price levels. This is part of the series try to explain why looking at prices is not sufficient to explain future direction of production or supply. The roughly 17–20% decline in WTI prices between March 2025 and April 2025, from about $69 to $57, is often cited as the type of shock that should significantly slow U.S. shale activity. If we stick to the basic understanding of breakevens, a change of this magnitude would be reflected clearly and immediately in completion and capacity data. The operational evidence does not show that outcome.
Frac Job Counts rose meaningfully from early March to late April, ending about 12% higher than where they began despite interim volatility. While completions peaked in late March and dipped briefly in mid-April, activity rebounded quickly and closed April near cycle highs, indicating sustained operational momentum rather than a price-driven slowdown. The data suggests completion crews remained active and schedules intact, consistent with operators working through committed programs rather than reacting to short-term price moves.
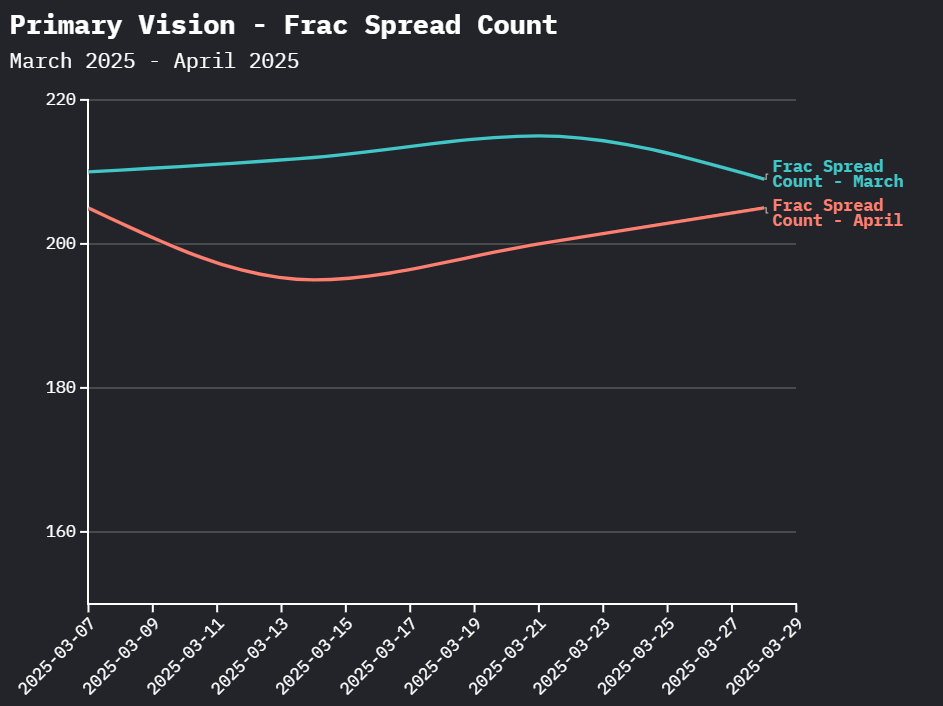
Frac Spread Counts show how service capacity adjusted over the same period. FSC peaked at 215 in mid-March and fell to a low of 195 in mid-April, a decline of approximately 9%. This reduction is notably smaller than the price move and occurred gradually. Importantly, spreads stabilized and began to recover before prices rebounded. This pattern suggests that capacity was flexed at the margin rather than withdrawn wholesale. The implication is that service availability introduces inertia into the system, preventing abrupt shifts in activity even when prices fall sharply.
Source: Primary Vision - Frac Spread Count
Comparing FJC and FSC together sharpens the picture. While spread counts declined modestly by roughly 9%, completions did not experience a sustained contraction and instead recovered quickly, finishing the period higher than they began. This divergence suggests that operators absorbed temporary capacity reductions through efficiency gains, sequencing adjustments, and schedule discipline rather than by cutting work. Completions were worked through with fewer spreads, reinforcing that near-term activity levels are governed by execution and program momentum, not by breakeven economics or short-term price signals.
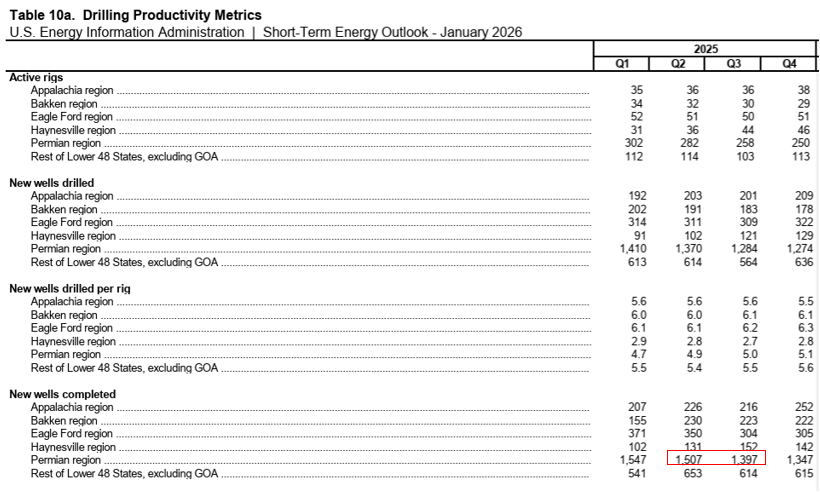
Quarterly well data from the U.S. Energy Information Administration place these weekly trends into a broader context. In the Permian Basin, new wells completed declined from 1,507 to 1,397, a reduction of roughly 7%. Over the same period, cumulative drilled but uncompleted wells fell from 1,007 to 821, a drawdown of about 18%. Rather than preserving inventory in response to lower prices, operators continued to work it down. The implication is that inventory depth and quality, not price, determined completion behavior.
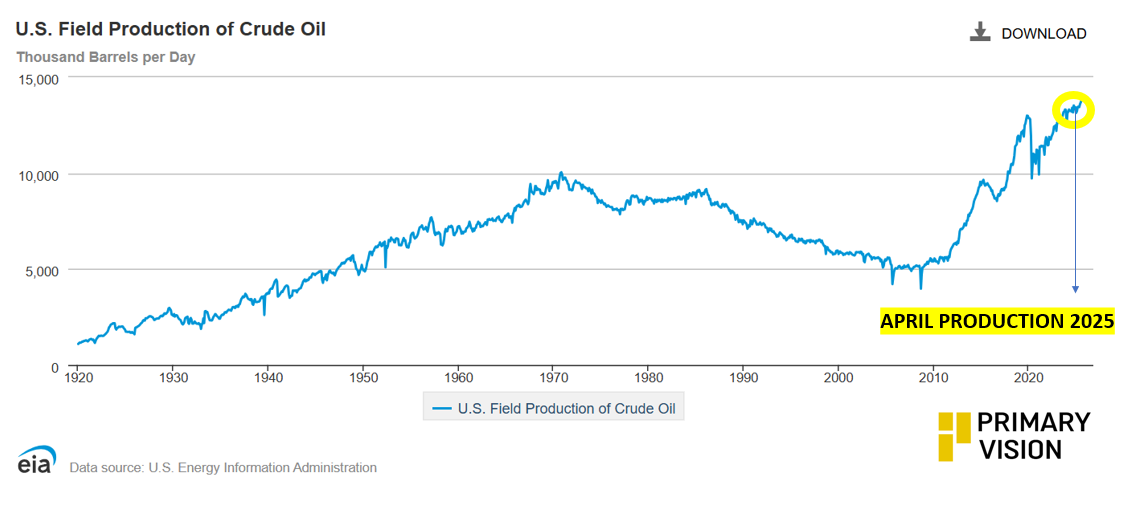
Production data reinforce this conclusion. Crude oil production from newly completed Permian wells declined from 448 to 443 thousand barrels per day, a change of only about 1%, while production per rig increased modestly. These outcomes are inconsistent with a system reacting defensively to a sharp price decline. Instead, they point to continued execution and improving efficiency.
Source: EIA - annotations by Primary Vision
Taken together, the March–April period shows that shale activity does not respond mechanically to price. Outcomes are shaped by how capital has already been allocated, how much viable inventory remains, and how efficiently that inventory can be executed with available service capacity. Frac Job Counts, Frac Spread Counts, and EIA well data capture these forces directly. Price matters, but it operates through these constraints rather than dictating behavior on its own.
Upgrade to Pro Today and get…
• This article — plus dozens more each month, all within our full Research Module
• Frac Hits — our National-Level Frac Spread Count and Frac Job Count, updated weekly
• Frac Operator Monitor — detailed FSC & FJC by operator
• And so much more, designed to help you track, forecast, and outperform