

Articles
- BLOG / Articles / View
- Articles
Market Sentiment Tracker: What Happens to the Global Economy If the US Strikes Iran?
By Osama on February 24, 2026 in Market Sentiment
As US carrier strike groups position themselves in the Persian Gulf and diplomatic talks in Geneva hang by a thread, the world's most consequential economic question isn't about tariffs or inflation data — it's about what happens when the first missile flies toward Tehran.
To answer this, I ran original simulations based on current market data: Brent crude trading at $71 per barrel, US inflation sitting at 2.4%, and the Strait of Hormuz moving 21 million barrels per day, roughly 20% of the world's oil supply. Using Capital Economics' established sensitivity model — where a 5% increase in oil prices adds approximately 0.1 percentage points to inflation — I modeled three distinct escalation scenarios and their cascading effects on the global economy.
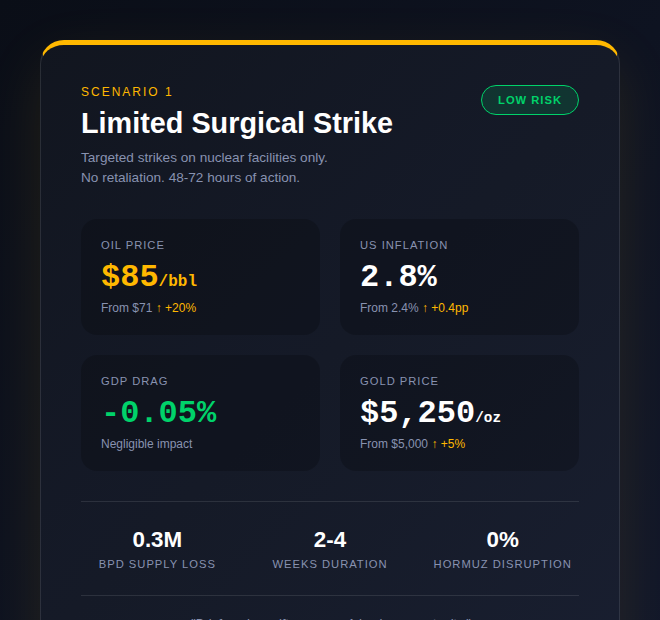
The first scenario assumes a limited surgical strike targeting only Iran's nuclear facilities, lasting 48 to 72 hours with no meaningful retaliation. This mirrors what happened last June when US strikes reportedly decimated Iran's nuclear infrastructure. In this case, oil would spike to around $85 per barrel, a 20% jump. Running that through the inflation model, we get an additional 0.4 percentage points on US CPI, pushing it to 2.8%. GDP drag would be negligible at 0.05%, and markets would likely normalize within two to four weeks. Gold might touch $5,250 before retreating. For investors, this scenario represents a buying opportunity — brief panic followed by a swift recovery.
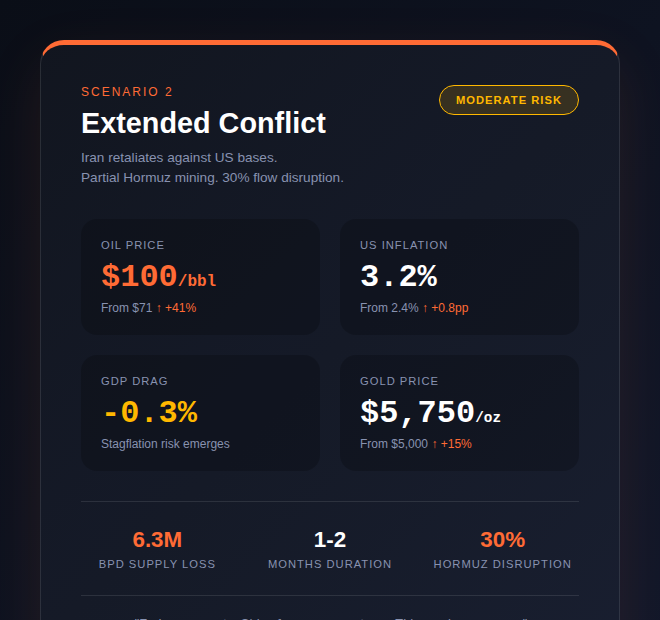
The second scenario is where things turn ugly. Here, Iran retaliates by striking US bases in the region and partially mining the Strait of Hormuz, disrupting approximately 30% of the waterway's flow. Iran's asymmetric warfare capabilities are well-documented: fast attack boats, anti-ship missiles, and naval mines that can choke 6.3 million barrels per day even without a full closure. Oil surges to $100 per barrel in this scenario, a 41% increase from current levels. The inflation math gets painful — an additional 0.8 percentage points pushes US CPI to 3.2%, while GDP takes a 0.3% annualized hit with roughly 0.24% spillover to global growth. The Fed pauses rate cuts. Stagflation risk emerges. Gold breaks $5,750.
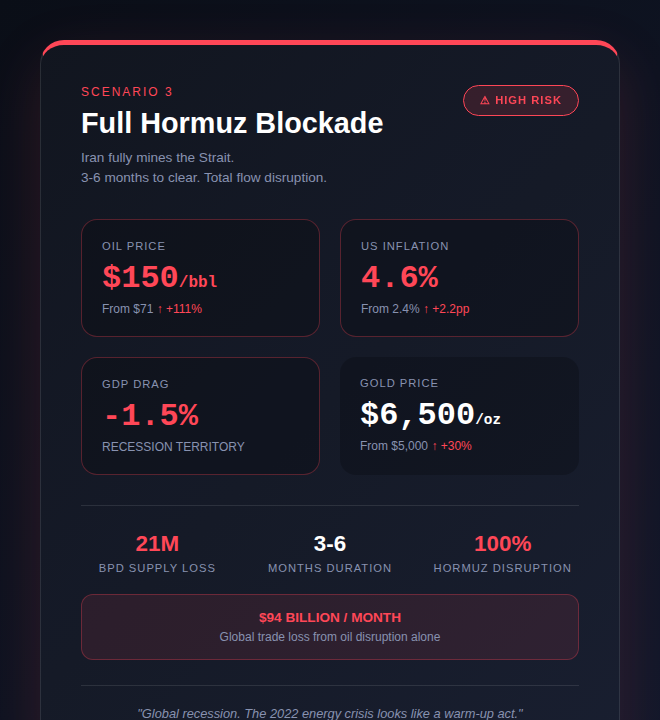
The third scenario is the nightmare that analysts whisper about but rarely model publicly: a full Hormuz blockade. Iran completely mines the Strait, and clearing operations take three to six months. The geography makes this disturbingly plausible — the Strait is only 21 miles wide at its narrowest point, entirely within Iranian and Omani territorial waters. In this case, oil explodes to $150 per barrel, a 111% surge. Applying the inflation formula, that translates to an additional 2.2 percentage points, pushing US CPI to 4.6%. GDP contracts by 1.5%, firmly in recession territory. The monthly trade loss from oil disruption alone hits $94 billion. Gold soars past $6,500. China's manufacturing economy seizes up. Europe, already teetering on the edge, falls into outright contraction. The 2022 energy crisis starts to look like a warm-up act. This is global recession, emergency Fed intervention, and a complete repricing of risk assets.
Now, a word on how I arrived at these numbers. I'm not pulling figures from thin air. For oil prices, I've taken the range that analysts from Capital Economics, Barclays, and FGE have floated in recent days — $85 for a contained strike, $100 if retaliation disrupts flows, and $150 if Hormuz goes dark entirely. The inflation sensitivity comes straight from Capital Economics' model, which I've applied consistently: every 5% rise in oil adds about 0.1 percentage points to consumer prices. For supply disruption, I've used EIA data showing Hormuz handles 21 million barrels daily, then calculated what a 30% or 100% closure means in lost volume. The GDP drag figures draw on historical parallels and the Tax Foundation's recent work on supply shock impacts. These aren't predictions — they're scenarios built on the best available data and assumptions that, frankly, could prove conservative if escalation spirals beyond what anyone in Washington or Tehran currently anticipates.
So which scenario is most likely? If history is any guide, Scenario 2. The United States has never shown appetite for prolonged Middle Eastern ground conflicts in the post-Iraq era, and the Trump administration — facing midterm elections and a consumer base already bruised by tariff chaos — has limited tolerance for $100-plus oil. But Iran has also never absorbed a major strike without responding. The regime's domestic legitimacy depends on it. A limited strike invites retaliation; retaliation invites escalation. The pattern is almost gravitational. Scenario 1 is what Washington wants. Scenario 3 is what keeps Pentagon planners awake at night. But Scenario 2 — messy, costly, and inconclusive — is what the Middle East usually delivers.
The next ten days will tell us which way the needle swings.
Tags:
Permission denied
Upgrade to Pro Today and get…
• This article — plus dozens more each month, all within our full Research Module
• Frac Hits — our National-Level Frac Spread Count and Frac Job Count, updated weekly
• Frac Operator Monitor — detailed FSC & FJC by operator
• And so much more, designed to help you track, forecast, and outperform


