Monday Macro View: Debunking the Shale Peak Narrative
By
Osama
on February 9, 2026
in
Market Sentiment
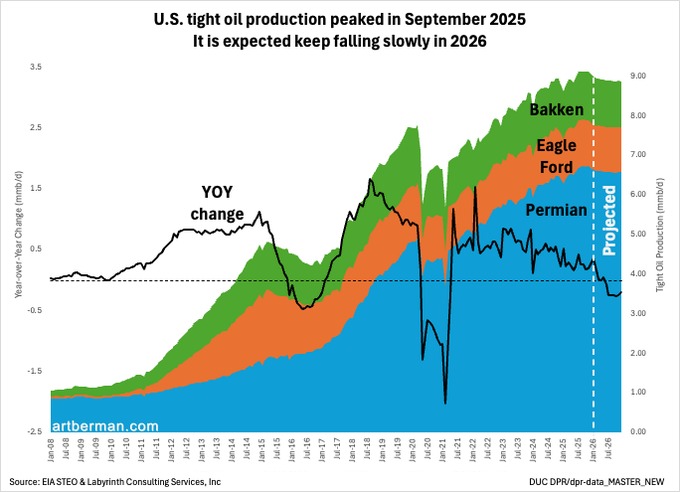
The narrative that U.S. shale has peaked is resurfacing once again. Recent charts showing year-over-year (YoY) production growth turning negative, combined with flat aggregate output since roughly September 2025, have fueled the argument that shale is entering terminal decline. However, we need to remind ourselves that this logic seems familiar. YoY growth also turned sharply negative in 2015–2016, when U.S. shale was widely declared exhausted — only for production to later exceed prior highs. As before, the key question is whether today’s data indicate a structural limit or a managed pause.
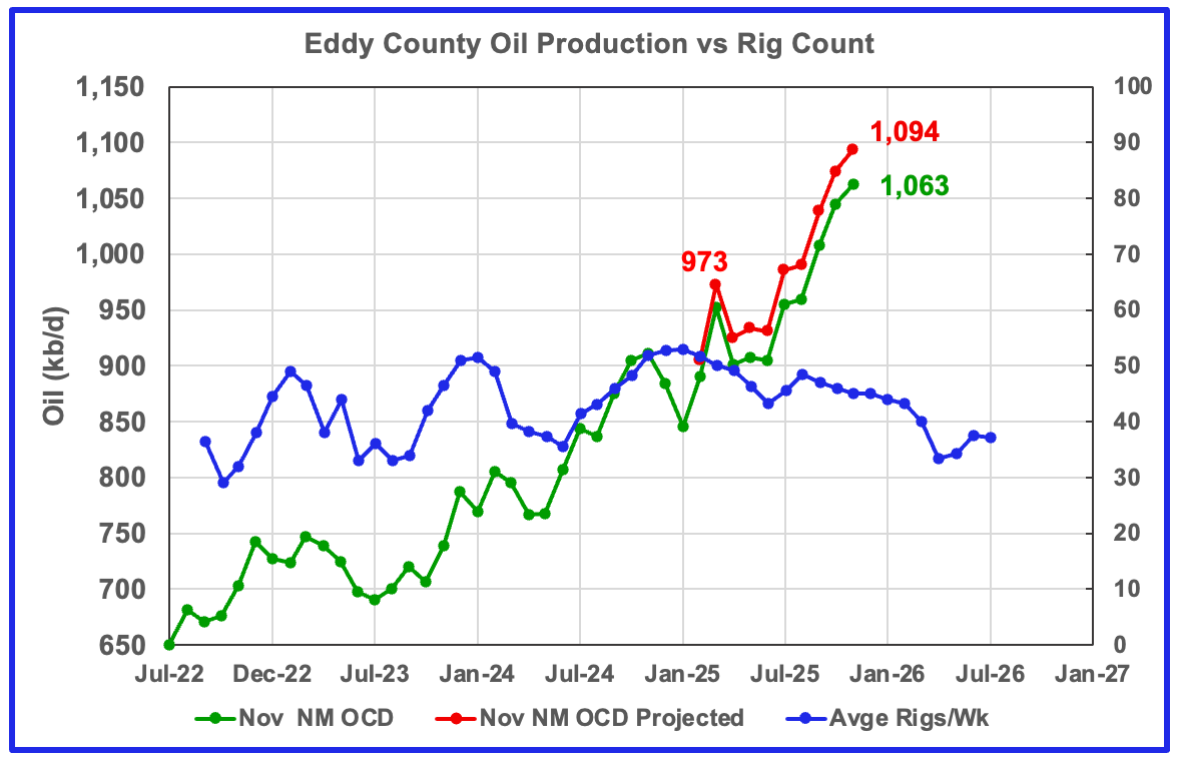
Independent state- and county-level data show late-cycle behavior but I don't see signs of a systemic collapse. Texas production appears to be on a plateau, with October underreporting exaggerating the perceived weakness in November projections. New Mexico has softened modestly, driven primarily by declines in Lea County following a prolonged plateau, while Eddy County continues to post material gains. North Dakota’s November output rose 12 kb/d to 1.189 mmb/d, coming in 3.4% above the state’s revenue forecast. So we have pockets of material gains in production.
Context and historical data is important to further analyze this. We saw a major rig decline in 2024 — from roughly 312 rigs to 256 rigs (down ~18%) yet we still saw U.S. oil production touching two record highs in 2025. This is where Primary Vision data materially shift the interpretation.
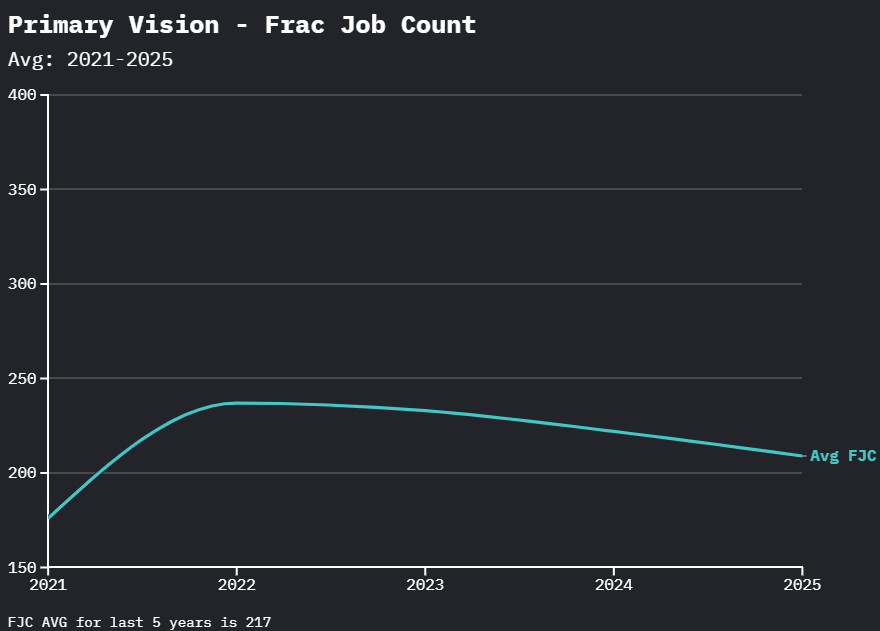
Primary Vision data indicate that U.S. Frac Job Count averaged 222 jobs in 2024, down modestly from 233 in 2023 and 237 in 2022, following a lower 176 average in 2021. This progression points to a normalization phase rather than a downturn. Importantly, this does not resemble a historical shale contraction in completion activity.
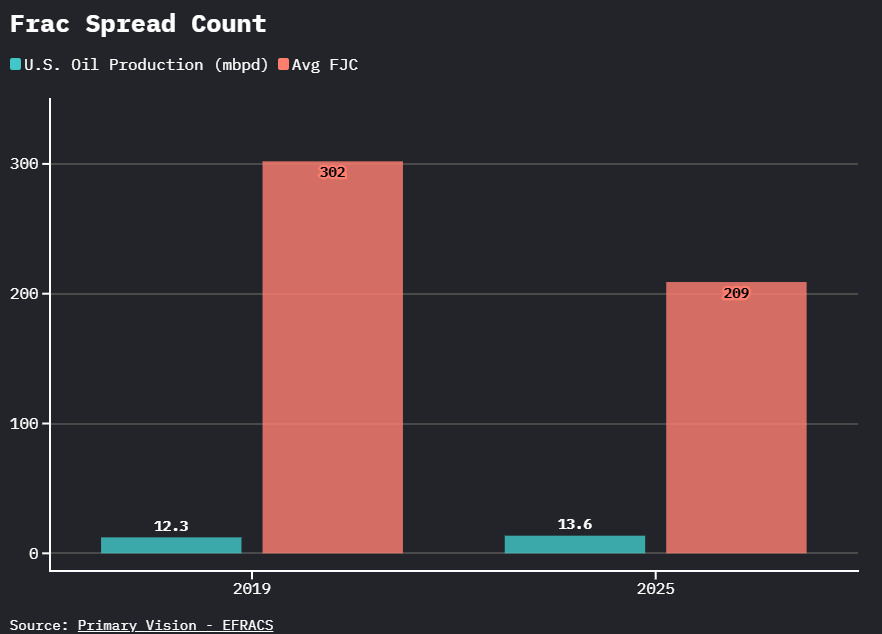
In 2019, U.S. oil production averaged approximately 12.3 mbpd with an average frac job count of ~302. By 2025, production has risen to roughly 13.6 mbpd, even as average frac job counts have declined to ~209, a reduction of more than 30%. This divergence implies a substantial increase in completion efficiency: implied production per frac job has risen by roughly 60% versus 2019 levels. The data point to materially higher effective frac utilization and productivity driven by longer laterals, higher completion intensity, multi-well pad development, and faster cycle times, rather than a structural decline in U.S. shale activity.
Technically, this aligns with how shale development has evolved. Operators are deploying denser cluster spacing, higher fluid volumes, tailored completion chemistry, and pressure-managed sequencing — often referred to loosely as “molecular frac’ing.” These techniques improve recovery efficiency and slow declines. Primary Vision data show operators continuing to apply effort in the face of production challenges and geopolitical uncertainty translating into market confusion.
This reconciles the apparent contradiction. If shale had truly peaked in a structural sense, there would already be signals regarding persistent, double-digit declines in frac jobs and a breakdown in forward visibility. It is not.
The conclusion is precise: U.S. shale is stable — and conditionally capable of growth. Production is flat in some places. Confusing a managed plateau for a hard peak risks repeating the same analytical mistake made a decade ago
Upgrade to Pro Today and get…
• This article — plus dozens more each month, all within our full Research Module
• Frac Hits — our National-Level Frac Spread Count and Frac Job Count, updated weekly
• Frac Operator Monitor — detailed FSC & FJC by operator
• And so much more, designed to help you track, forecast, and outperform