

Articles
- BLOG / Articles / View
- Articles
Monday Macro View: Frac’ing Activity Picks Up Across Key Shale Basins
By Osama on October 27, 2025 in Market Sentiment
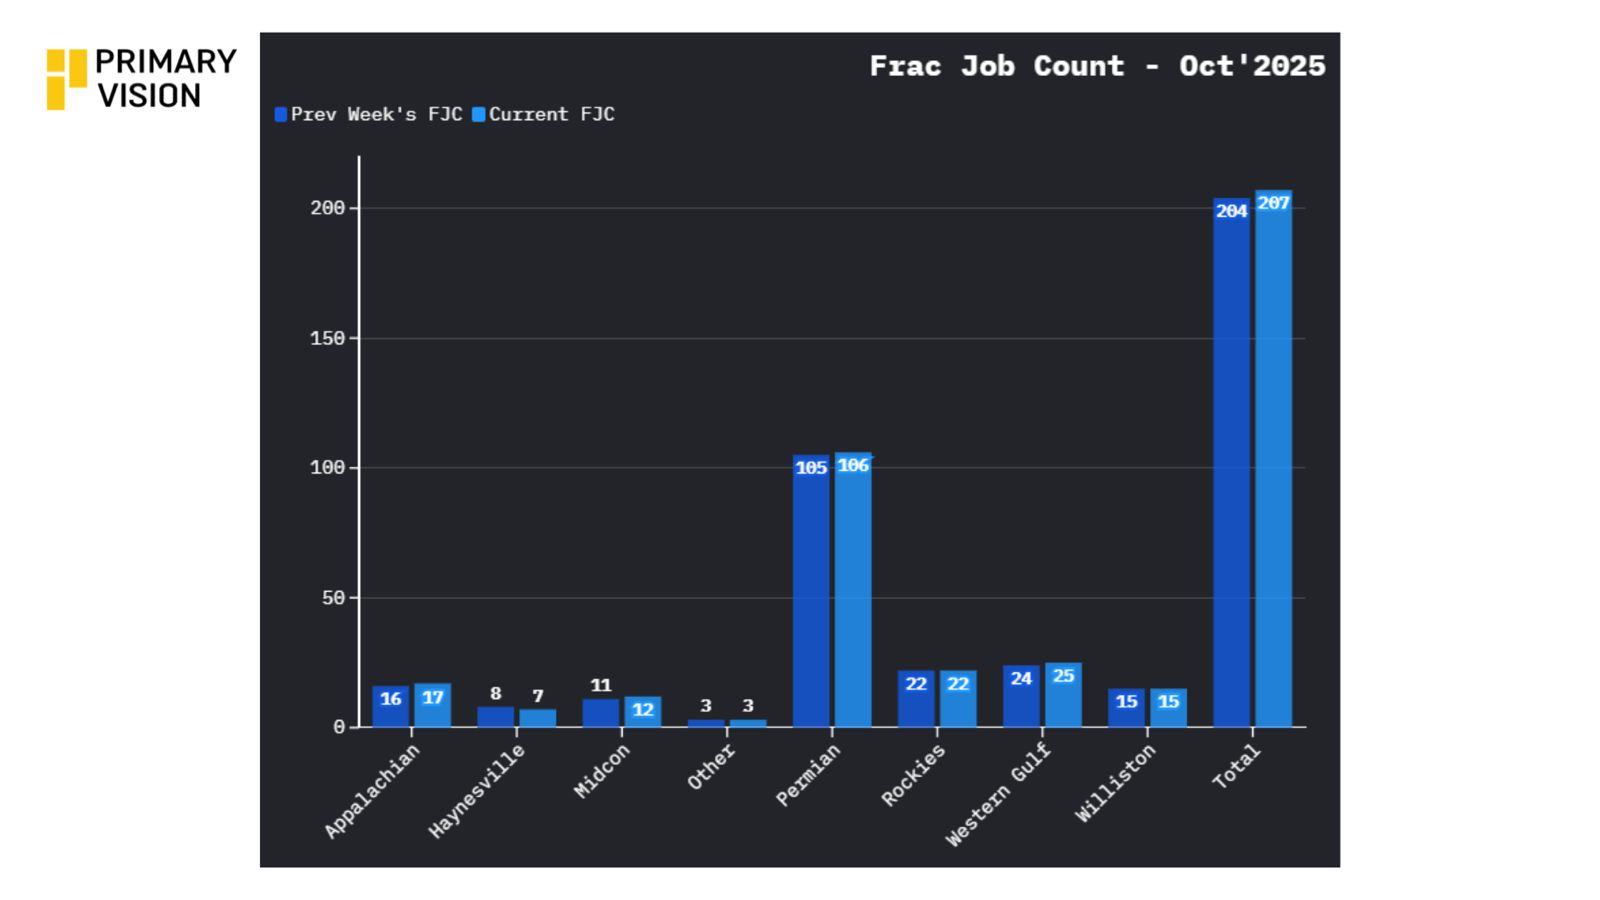
As we move into the final week of October, U.S. oilfield activity continues to show gradual improvement. The latest data from Primary Vision points to another week of modest gains, with both the Frac Spread Count and Frac Job Count edging higher. The Frac Spread Count rose to 178, up three from the previous week, while the Frac Job Count increased to 207, also higher by three. Rig counts climbed slightly as well, reaching 550, suggesting that operators remain active and disciplined as the year winds down.
The Permian Basin led the charge once again, with Frac Job Count rising from 105 to 106, reinforcing its position as the industry’s central growth engine. The Appalachian Basin also posted a slight improvement, moving from 16 to 17. In the Western Gulf, activity increased from 24 to 25, maintaining a steady upward trend that has persisted for several weeks.
Similarly, the FSC by shale basin shows that the gains were concentrated in a handful of smaller basins. Appalachia inched up from 15 to 16, and Denver posted the biggest single move, rising from 9 to 11, suggesting a short burst of crew reactivation after several quiet prints. Uinta-Piceance also firmed by one spread, moving from 3 to 4, consistent with the gradual normalization we’ve seen there since early fall. Elsewhere, activity was steady. Permian held at 80 spreads—still the anchor of national completions capacity but not the incremental driver of this week’s uptick. Anadarko remained at 9, Western Gulf was unchanged at 18, and Williston stayed at 15.

In this installment of MMV I'd also like to talk about the NGL supply demand dynamics. Our Efracs platform has a dedicated "NGL Apps" section that not only gives the user the option to trace the aggregate demand and supply but also break it down by hydrocarbons (such as propane, butane etc) and supply source (such as gas plants, refineries etc). Now what is the latest reading showing us?
Efracs’ NGL monitor tracks ethane demand volume using extensive historical data and predictive modeling. The chart, which spans from 2010 through early 2026, shows a steady climb from below 1,000 to above 3,000 in volume units, reflecting more than a decade of structural growth. This long-term trend captures the surge in ethane use within petrochemical complexes worldwide, particularly in the United States, Asia, and the Middle East, where demand is closely tied to ethylene production. The red forecast segment on the chart continues this upward trajectory, suggesting that global ethane consumption will maintain positive momentum into 2026. This projection aligns with real-world developments, such as new crackers coming online and a broader shift toward light feedstocks in chemical manufacturing.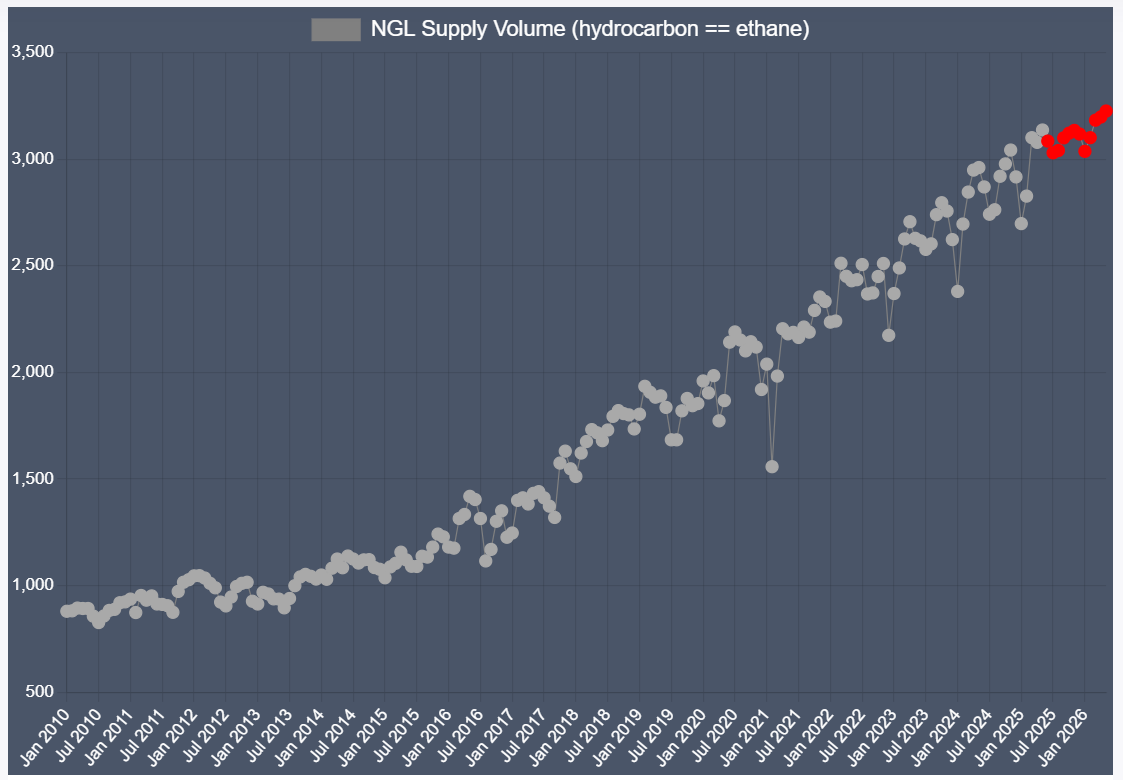
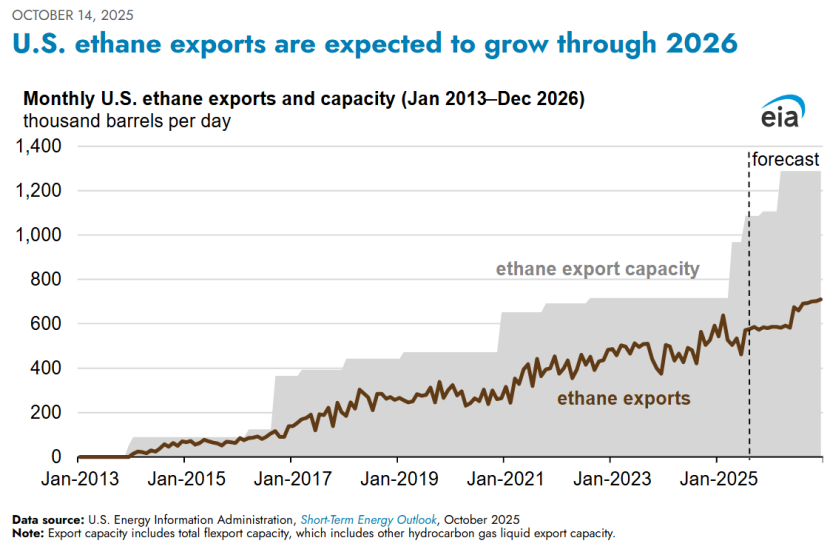
The EIA’s recent outlook echoes this story from the supply and trade side. Its October 2025 release shows U.S. ethane exports and export capacity continuing to rise sharply through 2026, reaching levels near 1.4 million barrels per day in total capacity. The parallel between these two perspectives is striking. While Efracs’ model captures the pull of global demand, the EIA highlights the U.S. response—growing exports to meet that demand. Together, they depict a synchronized market dynamic in which domestic production strength and international appetite reinforce each other.
Efracs’ forecasting accuracy stems from its integration of real-time frac spread data, infrastructure tracking, and NGL yield modeling. These inputs allow the platform to anticipate shifts in supply and demand before they appear in government datasets. The upward trend shown in the Efracs chart—beginning its next phase of growth around 2024 and extending into 2026—precedes the EIA’s own projection, effectively validating the model’s predictive power.
The next few weeks will show whether this uptick in completions is the start of a stronger push into year-end or just a brief rebound before activity levels settle again. Much will depend on how operators read the oil market and how prices respond to shifting supply risks. The latest sanctions against Russia add a new factor that needs to be accounted for. Rather than easing prices, they have the potential to tighten global supply and push crude higher, which in turn could sustain or even lift the current pace of frac activity. If that happens, both the Frac Spread Count and Frac Job Count could find additional support heading into November.
Tags:
Permission denied
Upgrade to Pro Today and get…
• This article — plus dozens more each month, all within our full Research Module
• Frac Hits — our National-Level Frac Spread Count and Frac Job Count, updated weekly
• Frac Operator Monitor — detailed FSC & FJC by operator
• And so much more, designed to help you track, forecast, and outperform


