

Articles
- BLOG / Articles / View
- Articles
Monday Macro View: FSC and FJC consistent with U.S. record high production in September
By Osama on December 8, 2025 in Market Sentiment
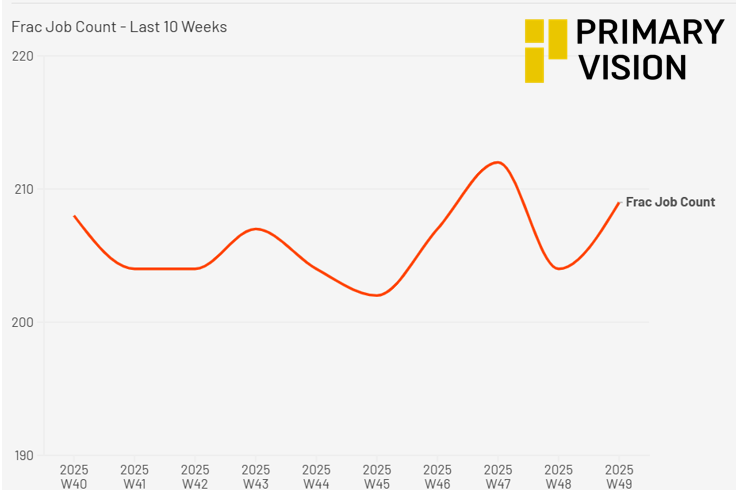
As noted in last week’s MMV, job activity, Frac Job Count, rebounded to 209, and the Frac Spread Count, meanwhile, remained steady. Now this fits neatly into last year's pattern where we saw a dip during Thanksgiving week and then return to normal after that. But the good news is that the U.S. shale production touched new record high in September as per the EIA. Interestingly, when we look at our FSC and FJC numbers it once again beats other indicators in predicting this steady/rising trend.
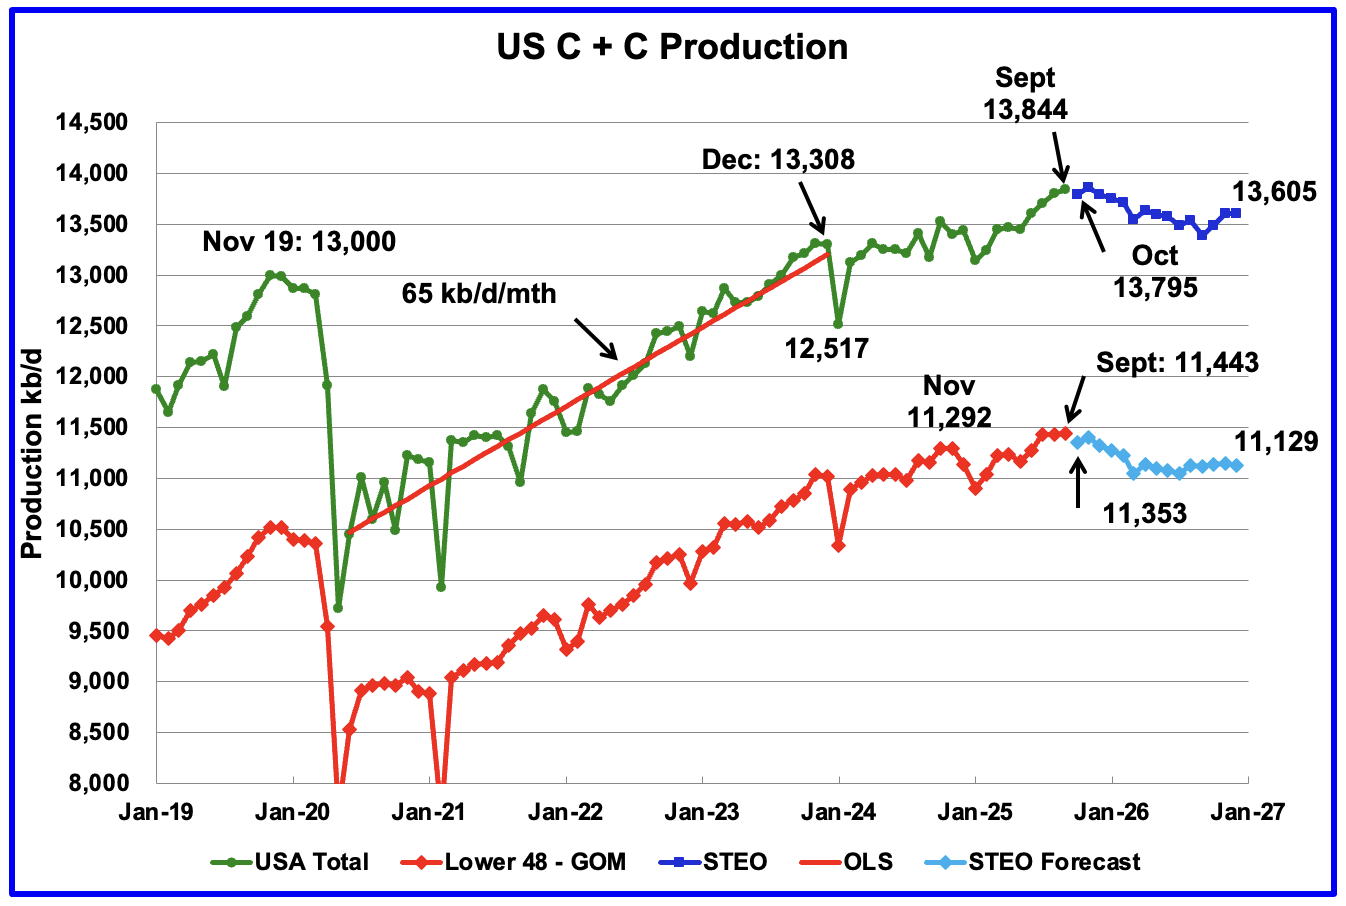
Onshore Lower 48 oil production has been essentially steady with small increases since mid-summer at a very high absolute level. If we look at Primary Vision’s activity metrics we see a similar trend. The Frac Spread Count has hovered in the mid-170s since July, including this week’s 173 reading, which tells us the industry has found its “maintenance” level of spreads for now. Frac Job Count, by contrast, has averaged 206 in the last 10 weeks and is now at 209. At this level the number is only 1 below the levels seen in 2024. In other words, operators are holding a stable spread fleet but pushing more work through it, which fits with the idea that shale is trying to do more with roughly the same surface footprint: fewer rigs than in 2024, a relatively flat spread count, but enough completions intensity to keep Lower 48 volumes at or near record levels even as last STEO projected only marginal growth and then a slow drift lower into 2026.
The November STEO underestimated the production by a 59kb/d. Furthermore, it expects total U.S. production to slip from 13.844 mb/d in September to 13.605 mb/d by December 2026, a decline of 239 kb/d. For the onshore Lower 48, the projected decline is 314 kb/d over the same period. But as highlighted in my previous articles our EFRACS platform provide a different projection over the next 52 weeks where we see similar level of active spreads and somewhat increase in actual number of job completions.
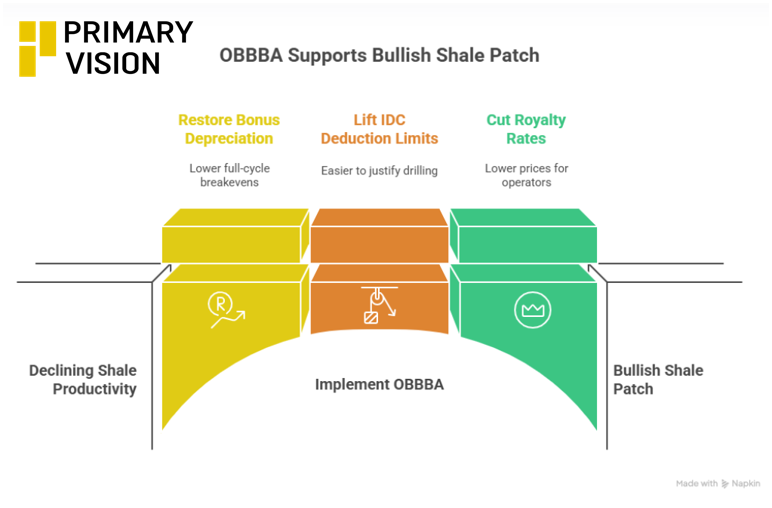
We have reason to believe that the mood in the shale patch will remain bullish. Look at the One Big Beautiful Bill Act (OBBBA) and how it is quietly shaping the floor under that activity. By restoring 100% bonus depreciation, lifting earlier limits on intangible drilling cost deductions, and cutting royalty rates on federal acreage, the OBBBA effectively lowers full-cycle breakevens and makes it easier for operators to justify drilling and completion programs at lower prices. Those provisions help explain why spreads will not fall more sharply and why FJC has pushed back above 200 even as many county-level indicators such as rising gas-oil ratios, plateauing output in key Permian counties, a shrinking gap between new well additions and legacy decline, falling DUC inventories, and a smaller rig fleet, suggest the system may be approaching its current productivity ceiling. Price alone would not support this level of activity; the combination of policy support and operators’ need to defend existing production profiles is what keeps the completion machine running.
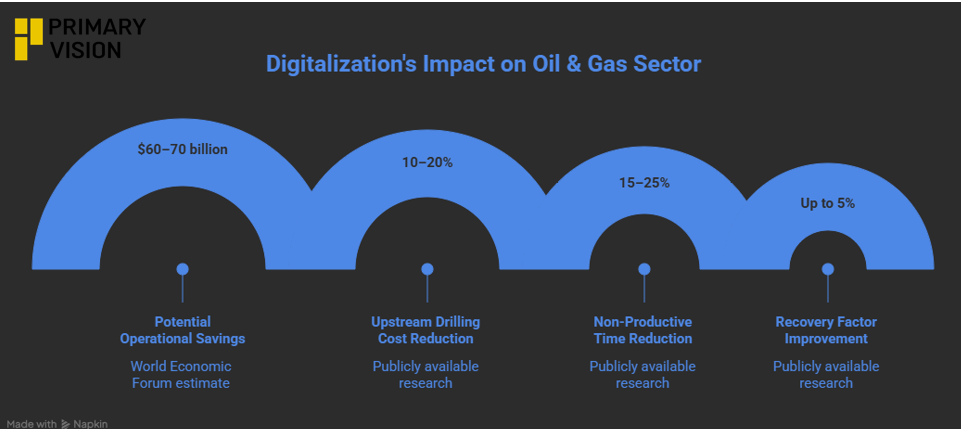
Digitalization is also emerging as a material offset to geological maturity, with publicly available research showing that upstream drilling and maintenance costs can be reduced by 10–20%, non-productive time can fall 15–25%, and improved modeling and digital-twin workflows can lift recovery factors by up to 5%. Broader studies from the World Economic Forum estimate as much as $60–70 billion per year in potential operational savings for the global oil and gas sector through expanded digital adoption, while the International Energy Agency highlights similar ranges for efficiency gains. Service-company disclosures reinforce this trend at the commercial level: SLB’s digital division operates at roughly 30–35% margins, Halliburton reports 8–12% gains from automated drilling systems, NOV shows 5–10% fuel-efficiency improvements from digital rig controls, and Baker Hughes cites up to 20% reductions in unplanned downtime from digital condition-monitoring tools. These data points collectively indicate that technology-driven gains are no longer theoretical—they are becoming a structural feature of the upstream sector, providing operators with meaningful levers to extract more performance from the same number of rigs, spreads and completion crews.
One idea that keeps coming up in 2025 industry discussions is that shale may be entering a period where competitive advantage shifts away from sheer scale and toward adaptability. With productivity gains slowing and geology becoming more variable across basins, the operators that adjust fastest to localized conditions—water availability, pressure management, gas handling constraints, regulatory changes—may define the next phase of the sector. Several 2025 analyses point to growing differences in well performance across counties, suggesting that basin-level averages now conceal wider dispersion. If that trend continues, 2026 could reward technical agility far more than uniform strategies or standardized development plans.
Tags:
Permission denied
Upgrade to Pro Today and get…
• This article — plus dozens more each month, all within our full Research Module
• Frac Hits — our National-Level Frac Spread Count and Frac Job Count, updated weekly
• Frac Operator Monitor — detailed FSC & FJC by operator
• And so much more, designed to help you track, forecast, and outperform


