

Articles
- BLOG / Articles / View
- Articles
Monday Macro View: Will Completions Counter OPEC+ Flows?
By Osama on September 22, 2025 in Market Sentiment
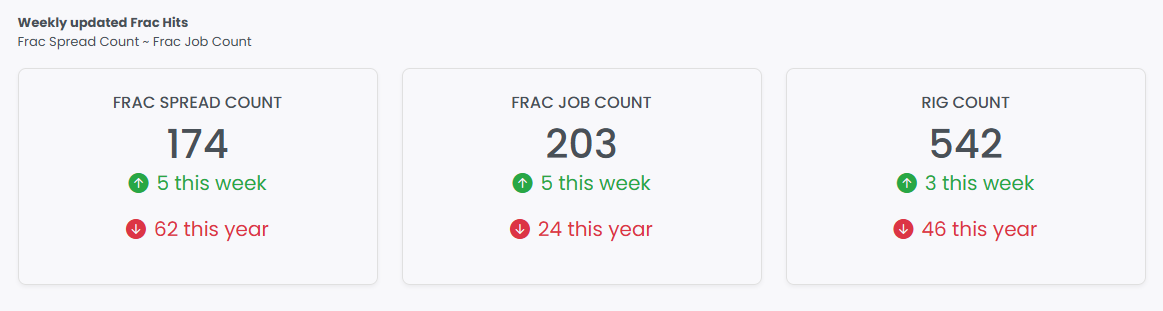
It’s Monday, and the latest numbers put U.S. shale on firmer footing. Primary Vision’s Frac Spread Count climbed to 174 last week, with the Frac Job Count matching the gain at 203. Even rigs edged higher, bringing the total to 542. Taken together, these figures point to a sector still grinding forward rather than rolling over. The EIA’s most recent production estimates reinforce the same picture: output is holding steady, underpinned by completions and efficiency, despite constant chatter about stagnation.
But the significance of these moves only becomes clear against the broader backdrop. In Singapore, APPEC sentiment leaned heavily bearish, with traders warning of a looming glut and price downside of as much as 15%. Yet Brent continues to hold above $65, thanks in no small part to Chinese stockpiling, which has quietly kept balances from tipping more visibly into surplus.
That context matters because OPEC+ is in the middle of its most aggressive supply return since the pandemic. The group has already restored 2.2 million b/d over the past six months and plans to add another 1.65 million b/d starting in October. Ordinarily, that volume would have sent prices lower, but Beijing has absorbed nearly 90% of the incremental supply, splitting purchases between commercial and strategic reserves. With another 140 million barrels slated for intake before March 2026, China’s stockpiling isn’t just cushioning the market — it’s effectively buying OPEC+ room to maneuver without collapsing prices.

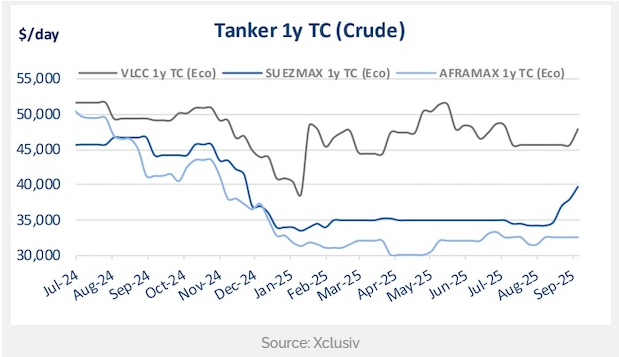
In contrast, tanker market data highlight how uneven trade flows remain. Russian seaborne exports rose slightly in August to 3.40 million b/d but still sit below spring peaks. The key shift was India’s intake, which fell by 21% to 1.30 million b/d, its lowest since January, after Washington imposed secondary tariffs on Russian crude. China picked up the slack with a 12% increase to a fresh yearly high of 1.11 million b/d, while Europe and Africa quietly re-emerged as marginal buyers. This reshuffling underscores both Russia’s flexibility in redirecting flows and the fragility of trade balances. Every rerouting away from India shortens voyage lengths, fragments ton-mile demand, and tightens effective vessel supply — a dynamic that could keep freight rates supported even as oil balances loosen.
The broader question is whether OPEC+ can manage the line between discipline and glut. Forecasts for Q4 point to global liquids supply reaching 108.3 million b/d against demand of 105.3 million b/d. That 3 million b/d surplus could pressure Brent below $60 if the group miscalculates. But it’s not lost on Gulf producers that geopolitical risk premiums remain embedded — from Middle East flashpoints to U.S.–China trade tensions — and that any disruption could quickly erase apparent surpluses.
For U.S. shale, the rise in FSC and FJC is a clear rebuttal to the “plateau” narrative. The layoffs and capex cuts announced by majors like Chevron and BP are about cost rationalization, not an end to growth. The completion side of the industry is quietly adapting and positioning for the next phase. In the coming weeks we will continue to watch OFS company guidance, U.S. crude exports, and OPEC+ output decisions. The numbers we track weekly are telling us that shale is far from done.
Crude oil production from newly completed wells continues to hold firm despite the slowdown in rigs. The EIA’s September STEO shows that Permian new wells are still adding just over 1 million barrels per day on a one-year trend, with Eagle Ford contributing around 73–76 kb/d and the Bakken steady at about 60 kb/d. That consistency underlines how much the industry is leaning on completions and efficiency gains to sustain output. Even as drilling programs scale back, operators are finding ways to keep new well productivity at levels high enough to offset broader weakness in rigs and capex.
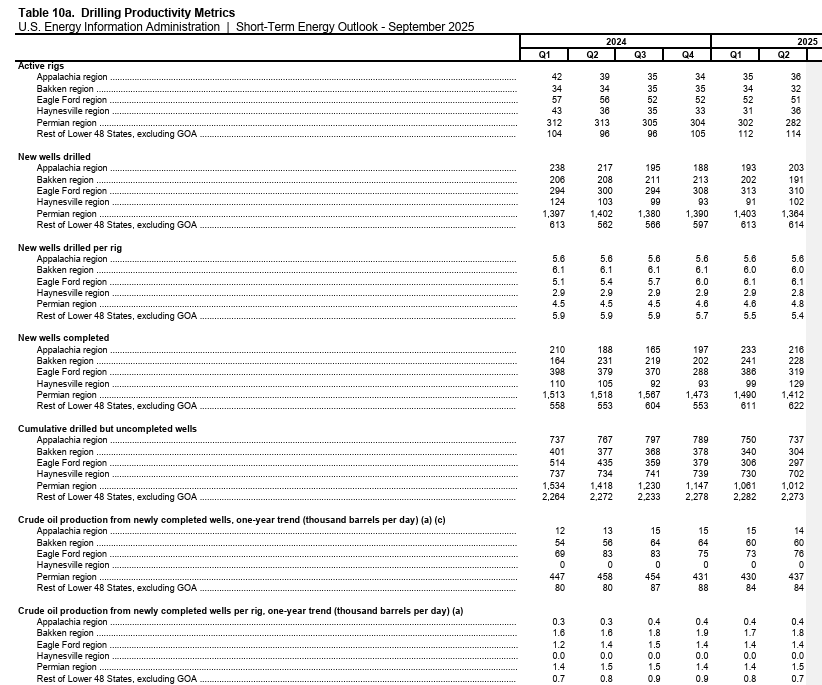
At the same time, the legacy decline curve is a reminder of how fragile this balance really is. Existing production from older wells continues to fall sharply year-on-year, with the Permian alone losing over 420 kb/d and both Eagle Ford and Bakken each shedding 60–80 kb/d. Across the Lower 48 outside the Gulf, the EIA estimates legacy declines of roughly 80–88 kb/d. The decline rates are real and steep, but the combination of steady new well productivity + high completions + DUC drawdowns is what keeps overall U.S. production flat to slightly rising.
In other words, shale is running just to stand still: the steady output from new wells is being used to plug a widening decline rate. It’s precisely this treadmill effect that makes the uptick in Primary Vision’s Frac Spread Count and Frac Job Count so important — completions have to stay elevated, or U.S. production would start to roll over quickly.
Tags:
Permission denied
Upgrade to Pro Today and get…
• This article — plus dozens more each month, all within our full Research Module
• Frac Hits — our National-Level Frac Spread Count and Frac Job Count, updated weekly
• Frac Operator Monitor — detailed FSC & FJC by operator
• And so much more, designed to help you track, forecast, and outperform


