

Articles
- BLOG / Articles / View
- Articles
Shale Reset: Why Activity Is No Longer Moving Together
By Avik on April 3, 2026 in Articles
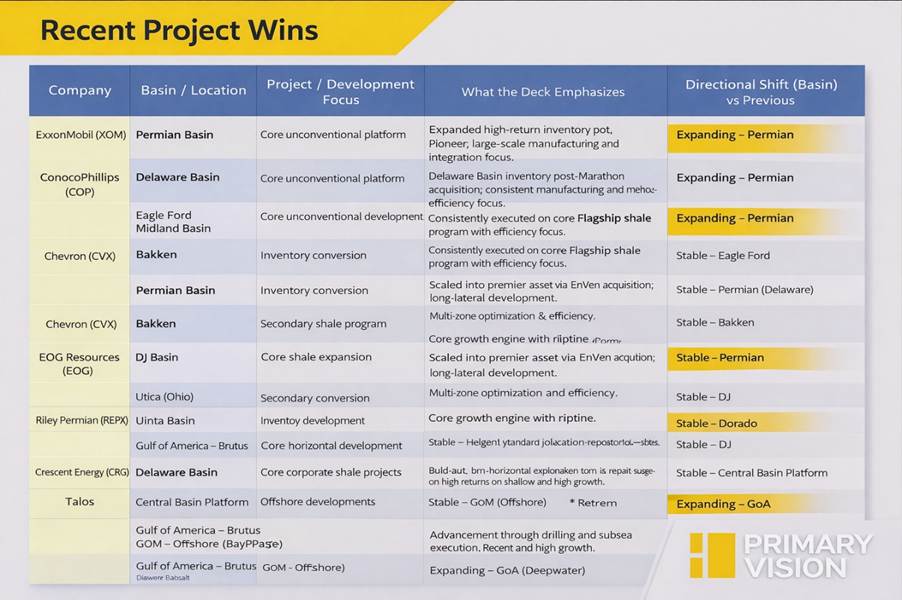
Inside the Shale Build-Out: Projects Are Now Driving the Divergence
When we last mapped U.S. shale projects in Q3, activity was still moving broadly in sync. That alignment has now broken. Recent updates show operators concentrating capital into specific projects and basins, rather than expanding across the board. This shift is showing up in frac job deployment, and increasingly, in stock performance since Q3.
The macro has not changed materially. Below roughly $55 oil, and under cost pressure, returns compress quickly. What has changed is execution. Operators are now being differentiated by their ability to convert projects into sustained frac activity, not just by inventory depth.
Permian Scale vs. Permian Selectivity
ExxonMobil has moved from integration to execution in the Permian following Pioneer. Its expanded footprint is now being developed through a manufacturing-style system, supported by infrastructure and inventory depth. The result is visible in frac trends, where activity appears consistent rather than reactive.
This consistency matters. It supports stable production and capital efficiency. Since Q3, Exxon’s stock has held up better than peers, reflecting confidence in repeatable, large-scale execution.
Chevron’s positioning remains steady. The Permian is still the core, with DJ as support, but there is no clear expansion signal. The focus remains on disciplined, repeatable development, which is reflected in stable but unaccelerated frac activity. The implication is straightforward. Chevron is protecting returns, not expanding its opportunity set. Its stock has remained range-bound since Q3, reflecting that balance.
ConocoPhillips: Delaware Scaling with Portfolio Balance
ConocoPhillips is leaning more clearly into the Delaware Basin as its primary growth driver, while maintaining steady programs in Eagle Ford and Midland. Bakken activity appears more tightly managed.
Each project plays a role. Delaware provides scale and inventory, Eagle Ford supports repeatability, and Midland adds incremental growth without volatility. This translates into balanced frac activity across basins, rather than a single area of intensity.
I think this gives ConocoPhillips resilience, particularly in a tighter pricing environment. However, the absence of a dominant growth signal limits upside visibility. Its stock performance since Q3 reflects that balance.
EOG: Strong Projects, Slower Translation to Activity
EOG continues to advance a diverse project slate, including Utica scaling, Powder River stacked-pay development, and Dorado gas integration, alongside Delaware and Eagle Ford.
The Utica program stands out as a new core build-out, while Powder River adds multi-zone optimization. Dorado reflects a continuous, gas-weighted development model.
However, frac deployment is selective rather than expansive, focused on high-return zones. This limits visible activity growth. I think this is the disconnect. The projects are strong, but the market is still looking for clear production and activity scaling.
Since Q3, EOG’s stock has lagged, suggesting that technical strength alone is not enough without visible execution scale.
Eagle Ford Concentration: Crescent’s Constraint
Crescent Energy remains centered on Eagle Ford manufacturing, with Uinta as a secondary lever. The model is clear—long laterals, repeatable development, and cash flow focus. The limitation is concentration. Activity remains tied to a single dominant basin, which caps scalability. Frac trends reflect this, showing steady but constrained deployment. Since Q3, this has translated into the weakest stock performance in the group. I think the market is discounting Crescent for limited expansion optionality, not execution.
Riley Permian: Execution Without Scale
Riley Permian continues development across Delaware, Yeso, and the Central Basin Platform, applying horizontal techniques to both core and non-core zones. These projects are execution-driven rather than expansion-led. The Yeso extends development into new formations, while CBP focuses on redevelopment. However, scale remains limited.
Frac activity reflects this—consistent but capped by capital and inventory depth. Since Q3, the stock has remained subdued, reflecting constrained scalability.
Talos: Offshore Projects, Different Drivers
Talos Energy’s projects—Brutus, Sunspear/Cardona, and Manta Ray—are offshore developments tied to infrastructure and first oil timelines, not continuous drilling. Value is driven by project visibility and execution milestones. Since Q3, Talos has shown relative resilience, reflecting this different model.
Frac Activity: Selective, Not Broad-Based
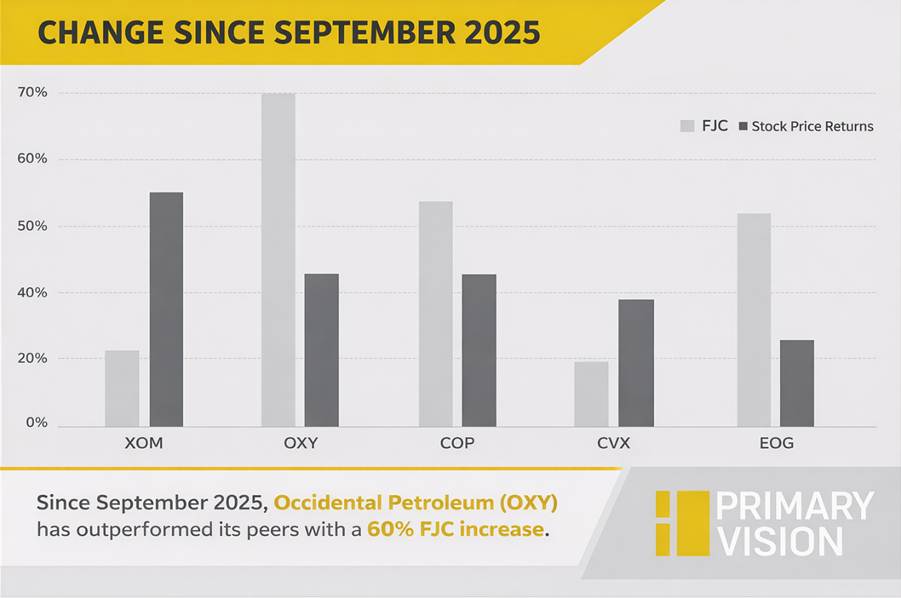
The divergence is clear in the chart. While Occidental Petroleum and EOG Resources show the strongest gains in frac activity, that momentum has not translated proportionally into stock returns, which remain comparatively muted. In contrast, ExxonMobil and Chevron have delivered stronger equity performance despite more moderate frac growth, suggesting the market is rewarding consistency and execution visibility over sheer activity expansion.
Takeaway
The shift is clear. Projects are no longer just positioning tools—they are defining activity levels and market outcomes. Exxon is leading because its Permian projects are translating into visible, sustained execution. ConocoPhillips remains balanced but lacks a clear catalyst. However, EOG’s project strength is not yet reflected in activity scale, delaying recognition.
Crescent and Riley highlight the limits of concentrated or small-scale portfolios, while Talos continues to operate on a separate offshore track. If conditions tighten, activity will concentrate further into projects with both scale and execution visibility, reinforcing the current gap rather than closing it.
Tags:
Permission denied
Upgrade to Pro Today and get…
• This article — plus dozens more each month, all within our full Research Module
• Frac Hits — our National-Level Frac Spread Count and Frac Job Count, updated weekly
• Frac Operator Monitor — detailed FSC & FJC by operator
• And so much more, designed to help you track, forecast, and outperform


