

Articles
- BLOG / Articles / View
- Articles
UPDATED: Monday Macro View: Why U.S. Oil’s Future Looks Stronger Than the Dallas Fed Suggests
By Osama on September 29, 2025 in Market Sentiment
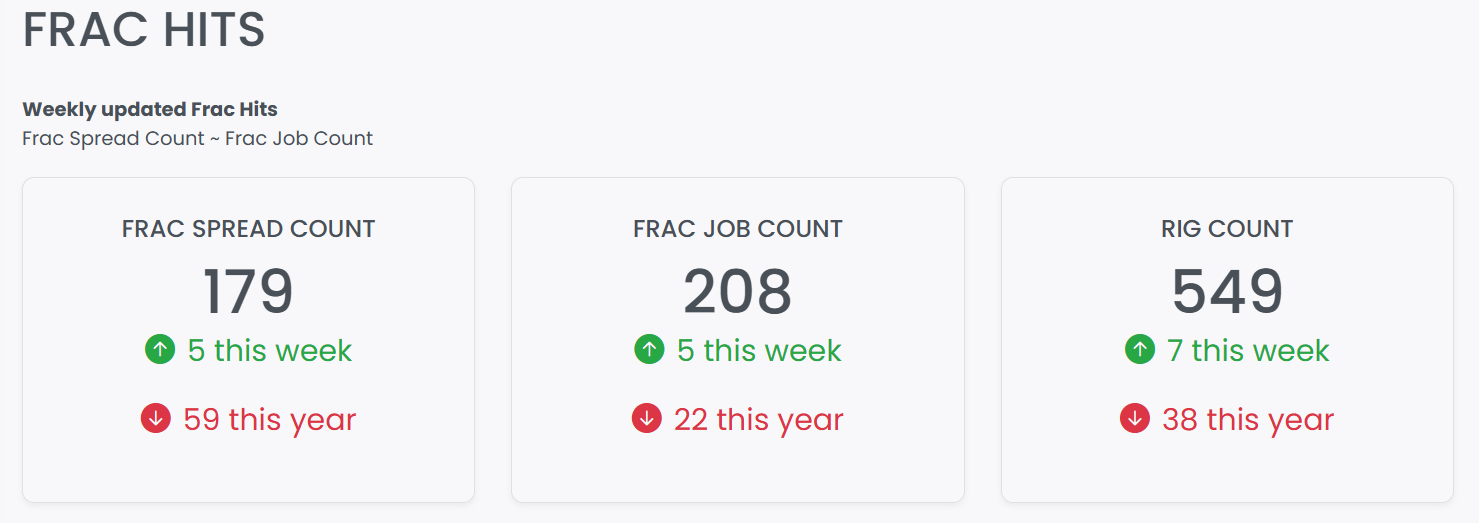
Correction (3rd October 2025): The previous version of the article mentioned the wrong figure for Frac Spread Count (FSC) for July 2025 end as 122. The correct number is 168 and therefore the implied percentage increase in FSC is 7% since last Dallas Fed energy survey came out.
The latest Dallas Fed Energy Survey paints a downbeat picture of the oil and gas industry. Business activity remained in contraction in the third quarter of 2025, with the index moving only slightly higher from –8.1 to –6.5. Outlooks deteriorated even more sharply, as the company outlook index fell from –6.4 to –17.6. Both oil and gas production stayed in negative territory, at –8.6 and –3.2 respectively, while cost pressures intensified, with lease operating expenses jumping from 28.1 to 36.9 and finding and development costs rising from 11.4 to 22.0. It is the sort of data that reinforces a story of slowdown and caution. Yet this is only one side of the picture — and once again, the wrong one is getting the most attention. Since late July 2025, when the last Dallas Fed survey was released, Primary Vision’s own measures of field activity have been telling a very different story.
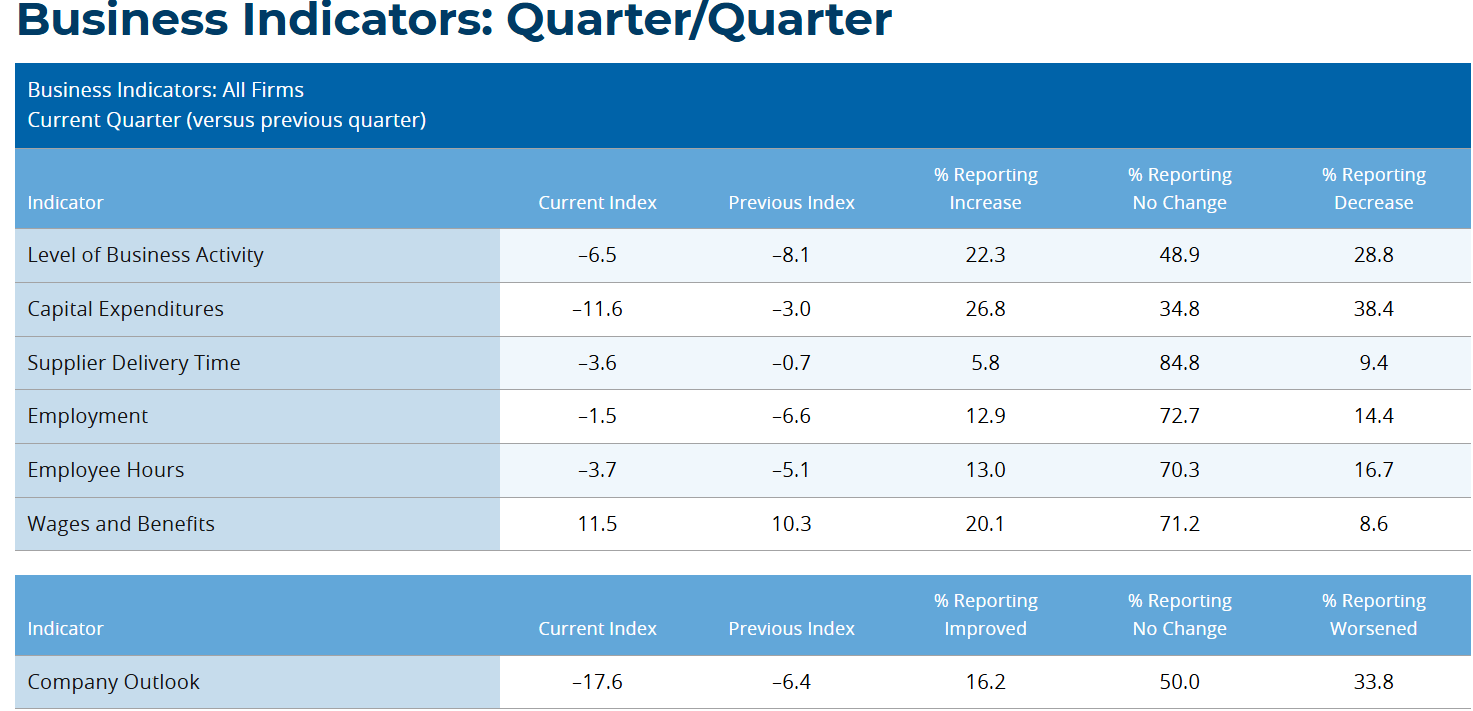
Source: Fed Dallas Energy Survey
Frac Spread Count has climbed from 168 at the end of July to 179 by the end of September, a 7% increase in just two months. Frac Job Count has moved steadily higher as well and is now only 22 below last year’s level - which means it has been consistent YoY basis whereas WTI prices have dropped almost 12% (based on monthly average prices from Sept'24 to Sept'25). This trend of resilience has echoed throughout this year even as prices entered lower 60s. Another important factor is that both metrics have now risen for three consecutive weeks, each time by five, underscoring that field activity is building rather than fading.
The picture is reinforced by what is happening on the export side. U.S. crude exports have surged to a fourteen-month high of 4.2 million barrels per day in September, up from 3.8 million in August and 3.2 million in July. At their peak, they reached 5.3 million barrels per day in the week ending September 12, the sixth-highest weekly level on record. That increase has already translated into physical market effects, with Gulf Coast inventories falling by nearly 11 million barrels in just two weeks and reversing part of the record 15 million barrel build seen since late June. This means that the system is clearing supply as flows accelerate to meet global demand.

Source: John Kemp, Best in Energy - Newsletter
What about oil demand?
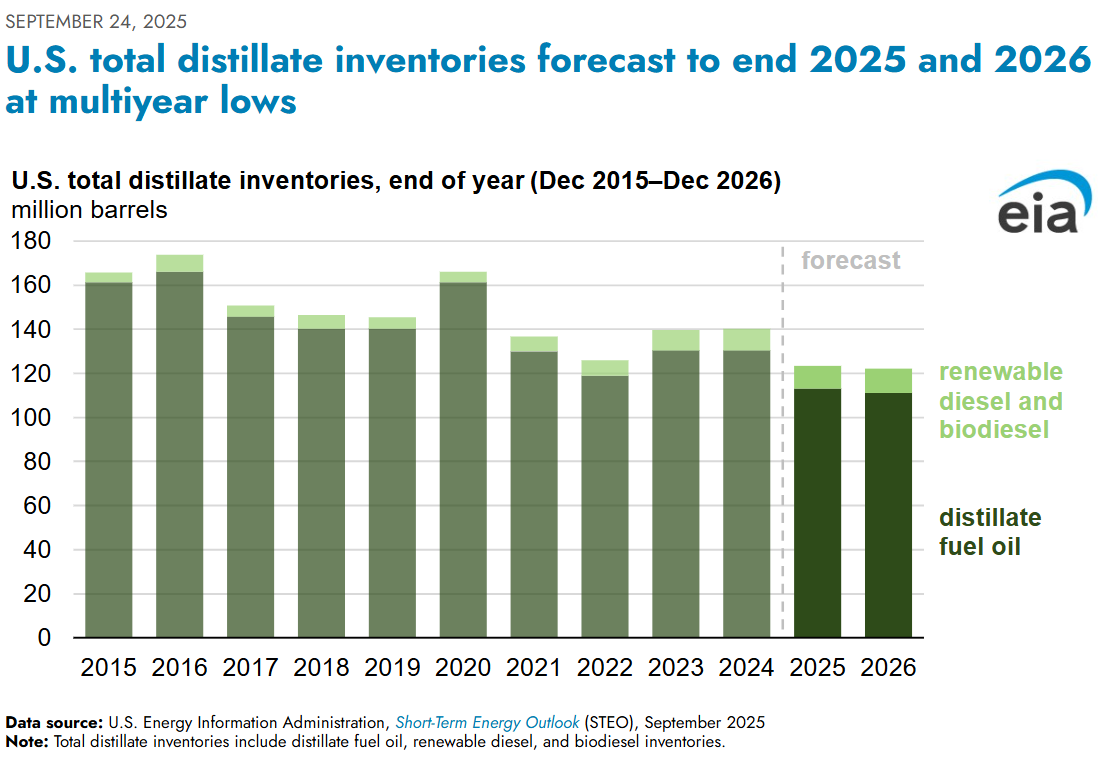
Another misconception that I want to highlight before ending this week's note is the assumption that low distillate stocks are a simple result of strong domestic demand. In reality, the situation is far more complex. U.S. total distillate inventories are expected to end both 2025 and 2026 at multiyear lows, reflecting a sharp 17% drawdown, about 22 million barrels, in the first half of 2025. That drawdown was driven in large part by a steep drop in renewable diesel and biodiesel availability, which fell by 35% year on year. The resulting supply gap increased demand for petroleum-based distillate by roughly 170,000 barrels per day, while exports of distillates averaged 1.2 million barrels per day, about 7% above the five-year average, pulling even more product out of domestic storage. Structural constraints on refining capacity have also played a significant role. The closure of LyondellBasell’s Houston refinery earlier this year, and two more closures planned in California, are reducing domestic production of petroleum products and limiting the ability to rebuild inventories.
The same point was raised by Primary Vision a few weeks ago where we mentioned that how "heatwaves across Asia, Europe, and North America lifted power generation demand in recent months. In the U.S. Midwest and South America, seasonal harvests are beginning to pull more diesel, and in Europe, the marine sector is increasingly leaning on diesel and gasoil as an alternative to higher-cost bunker fuel in emission control areas.". Click here for the full article.
Taken together, these realities paint a very different picture from the one suggested by sentiment surveys and headline indices. Field activity is rising, exports are surging, inventories are drawing, and supply is tightening. Focusing only on business confidence risks missing the fundamental shift underway in the market: production-linked activity is building momentum, the export machine is accelerating, and the balance of supply and demand is moving toward a tighter, not looser, landscape.
However, I accept that challenges are mounting with tariff uncertainty and macroeconomic weakness. But as of now, the U.S. shale is holding strong. I believe without any further shock or tailrisk, this trend of stability will continue.
Tags:
Permission denied
Upgrade to Pro Today and get…
• This article — plus dozens more each month, all within our full Research Module
• Frac Hits — our National-Level Frac Spread Count and Frac Job Count, updated weekly
• Frac Operator Monitor — detailed FSC & FJC by operator
• And so much more, designed to help you track, forecast, and outperform


