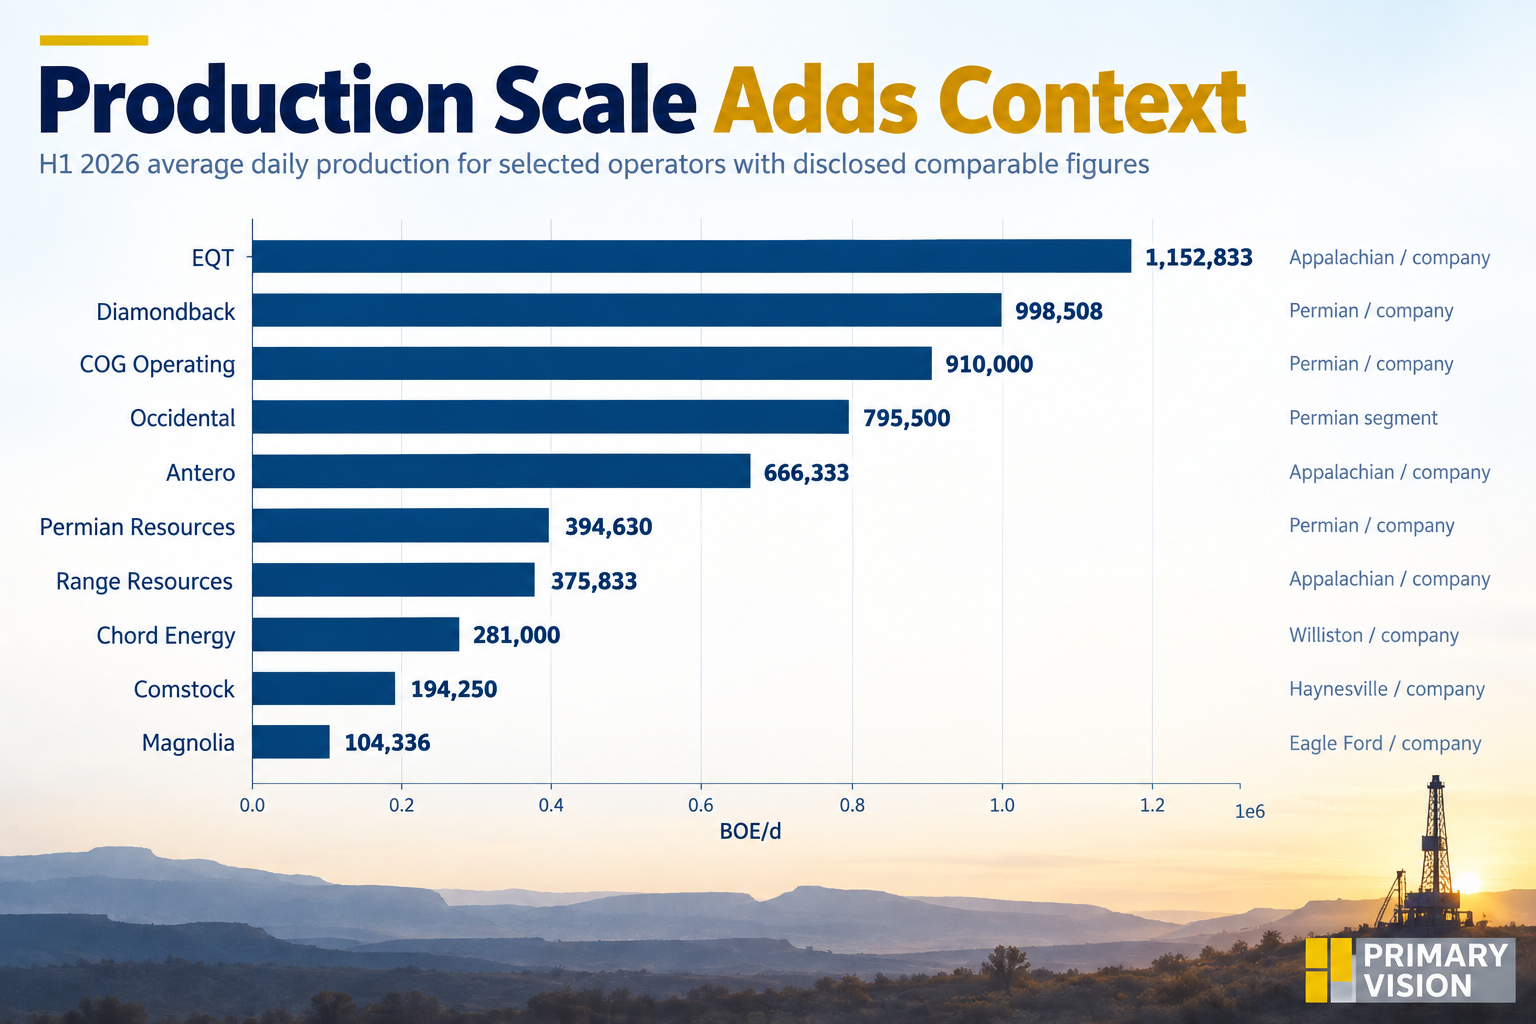
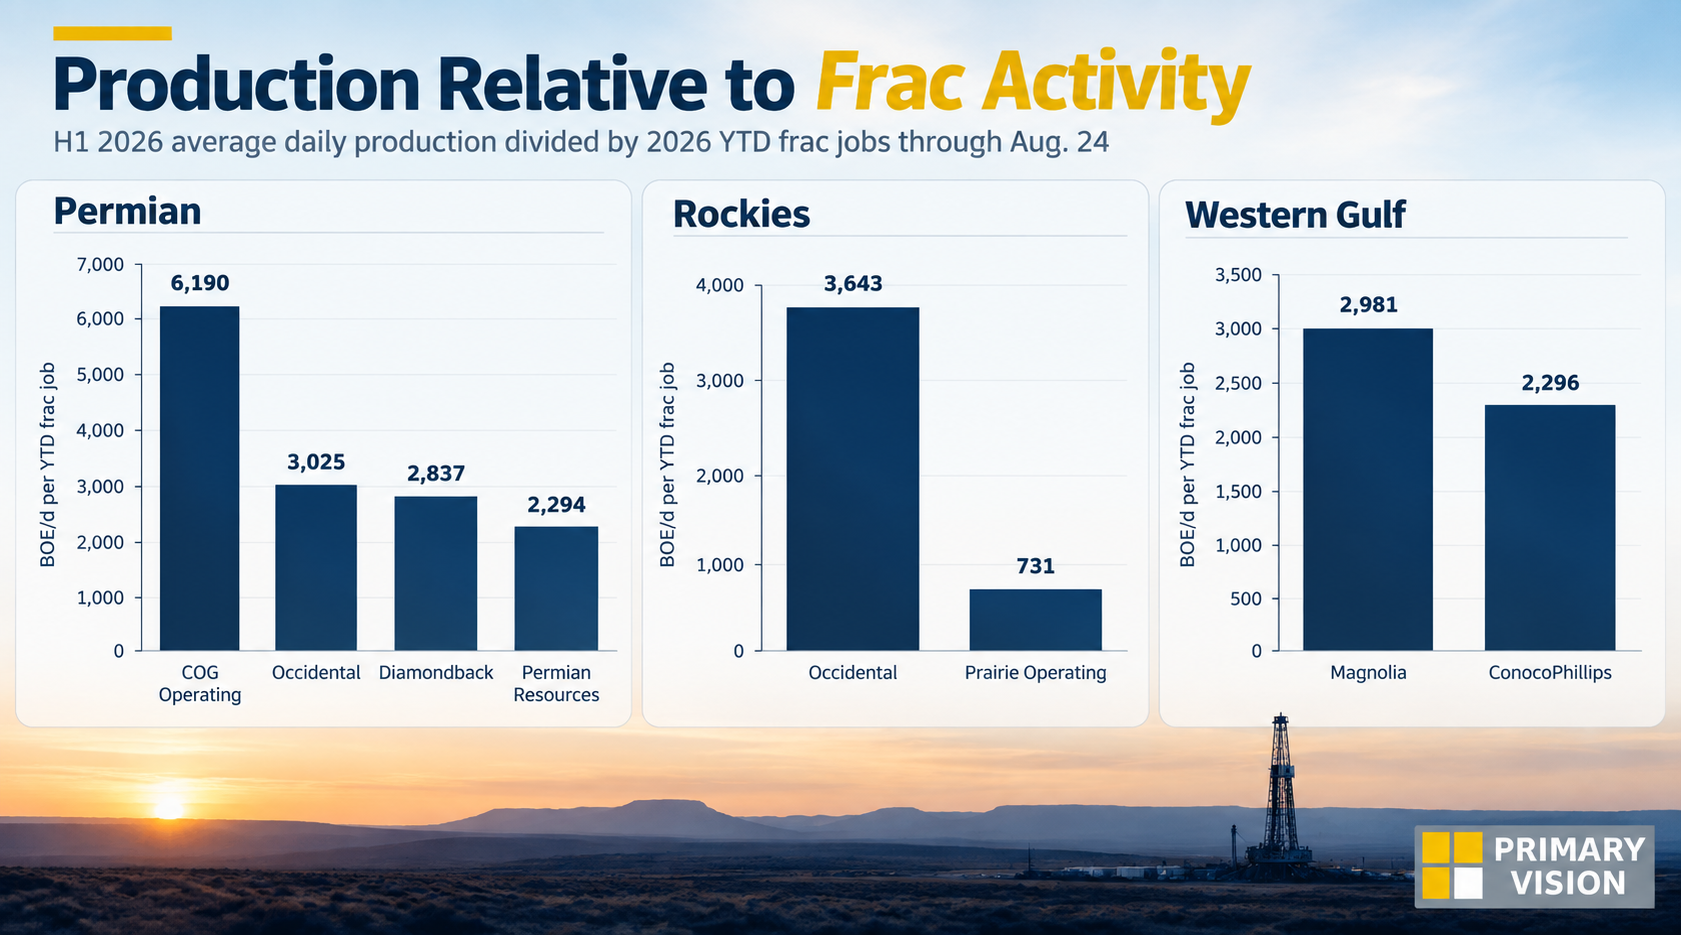
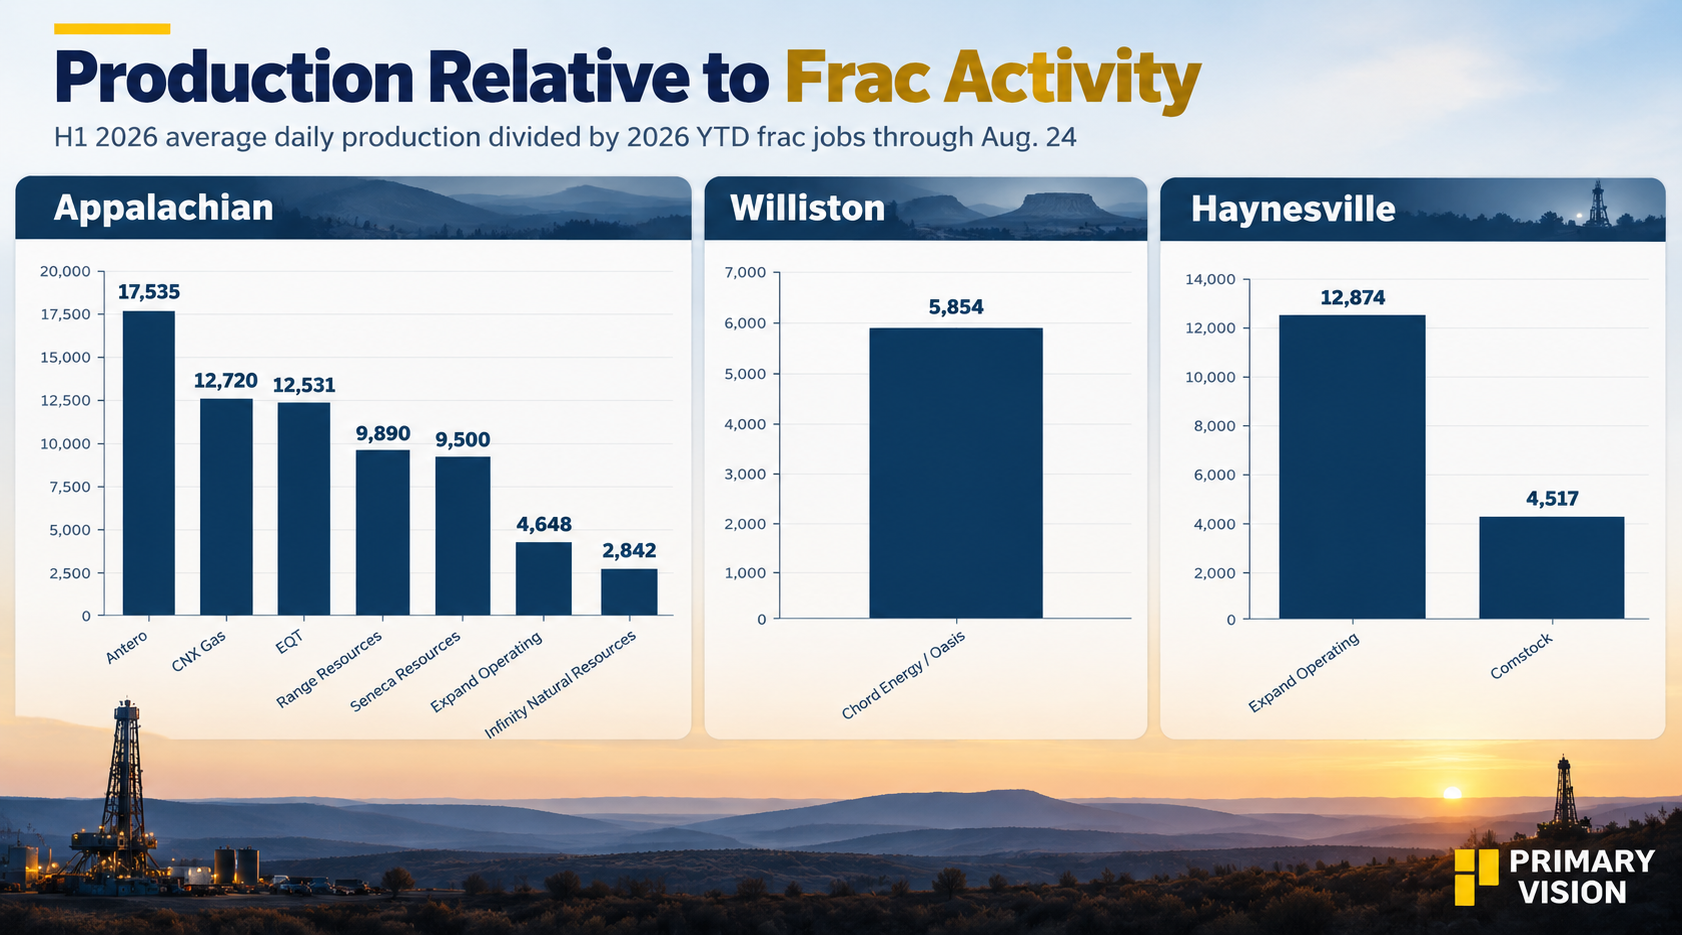
In this article, we analyze this: Frac activity tells us where operators are completing wells. Production tells us how much output those businesses are generating. The two measures are related, but they are not interchangeable.
The data used in this analysis also requires some care on timing. Frac jobs are measured YTD through August, while production is based on H1 2026 where comparable data is available. I would therefore use relative production changes and activity comparisons, rather than presenting production per frac job as an efficiency measure.
Production Trends Are Not Uniform
The H1 data shows different production trajectories even among active operators. In the Permian, Diamondback's average production increased ~4% from Q1 to Q2, while Occidental's Permian production increased about 2%. COG Operating's production increased approximately 3%. Permian Resources moved in the opposite direction, with production declining roughly 9%.
That variation is important. A meaningful frac program does not necessarily translate into an immediate increase in reported production. Timing differences among completion, production ramp-up, and reported volumes can create discrepancies between activity and output.
Appalachia Shows A Different Pattern
Antero's average daily production increased ~8% from Q1 to Q2, while Range Resources increased 4%. EQT's reported production is also significant in scale. Expand is another important example. It appears prominently in the frac data while also reporting substantial Appalachian gas production.
But because gas is converted to BOE using a standard 6:1 conversion, the resulting BOE figure should be viewed as a common-unit approximation rather than a measure of operating efficiency.
Why Production Responds Differently To Frac Activity
The production response depends on the quality and economics of each new completion. The Permian is a good example. It accounts for 55% of frac activity in our six-basin dataset. Yet production can grow without a similar increase in completion counts. Longer laterals and higher well productivity allow each completion to generate more output.
Gas basins have a different dynamic. Haynesville production is benefiting from stronger gas demand and LNG growth. EIA expects Haynesville output to increase by 1.2 Bcf/d in 2026. Appalachia has a much larger resource base, but pipeline constraints can limit how quickly new wells add to marketed production.
The data therefore points to a simple conclusion: frac jobs are the starting point, not the end point. Well productivity, commodity prices and takeaway capacity determine how much production ultimately comes from that activity.
What The Data Actually Shows
The updated dataset is most useful when it separates activity, production scale and production direction. Frac jobs show where completion activity is occurring. Production shows the scale of the resulting operating base. Quarter-to-quarter changes show whether reported production is rising or falling.
The key observation is that these signals do not always move together. That makes frac data valuable as an activity indicator, but insufficient on its own to determine production growth or operator efficiency.
Upgrade to Pro Today and get…
• This article — plus dozens more each month, all within our full Research Module
• Frac Hits — our National-Level Frac Spread Count and Frac Job Count, updated weekly
• Frac Operator Monitor — detailed FSC & FJC by operator
• And so much more, designed to help you track, forecast, and outperform