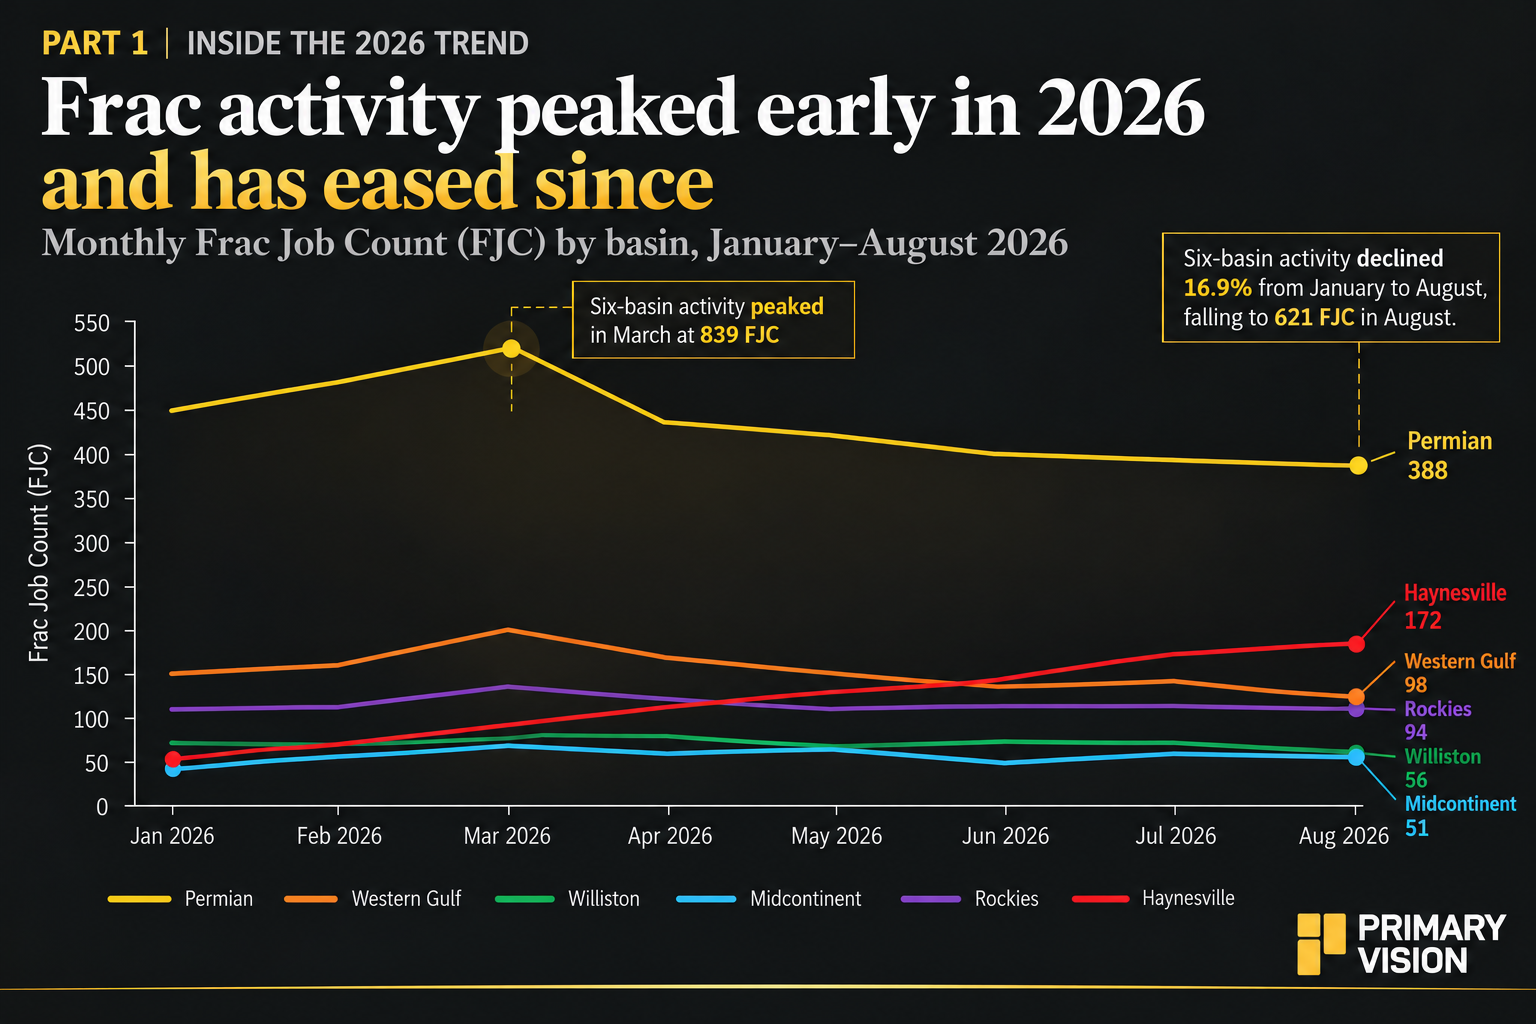
Regional Frac Job Count (FJC) declined across five of the six basins in the first half of 2026. The Permian fell 15.6%, Midcontinent declined 11.8%, Williston dropped 7.5%, Western Gulf eased 4.5%, and the Rockies slipped 3.6%. Haynesville moved in the opposite direction, rising 60.0%.
The contrast highlights how uneven shale activity has become. The Permian remains the largest activity center in this group, yet its regional job count is contracting. Haynesville's increase points to a different development backdrop, potentially including expectations for LNG and data-center gas demand. Those factors provide context, not proof of causation.
Operator Activity: The Basin Trend Is Only Half the Story
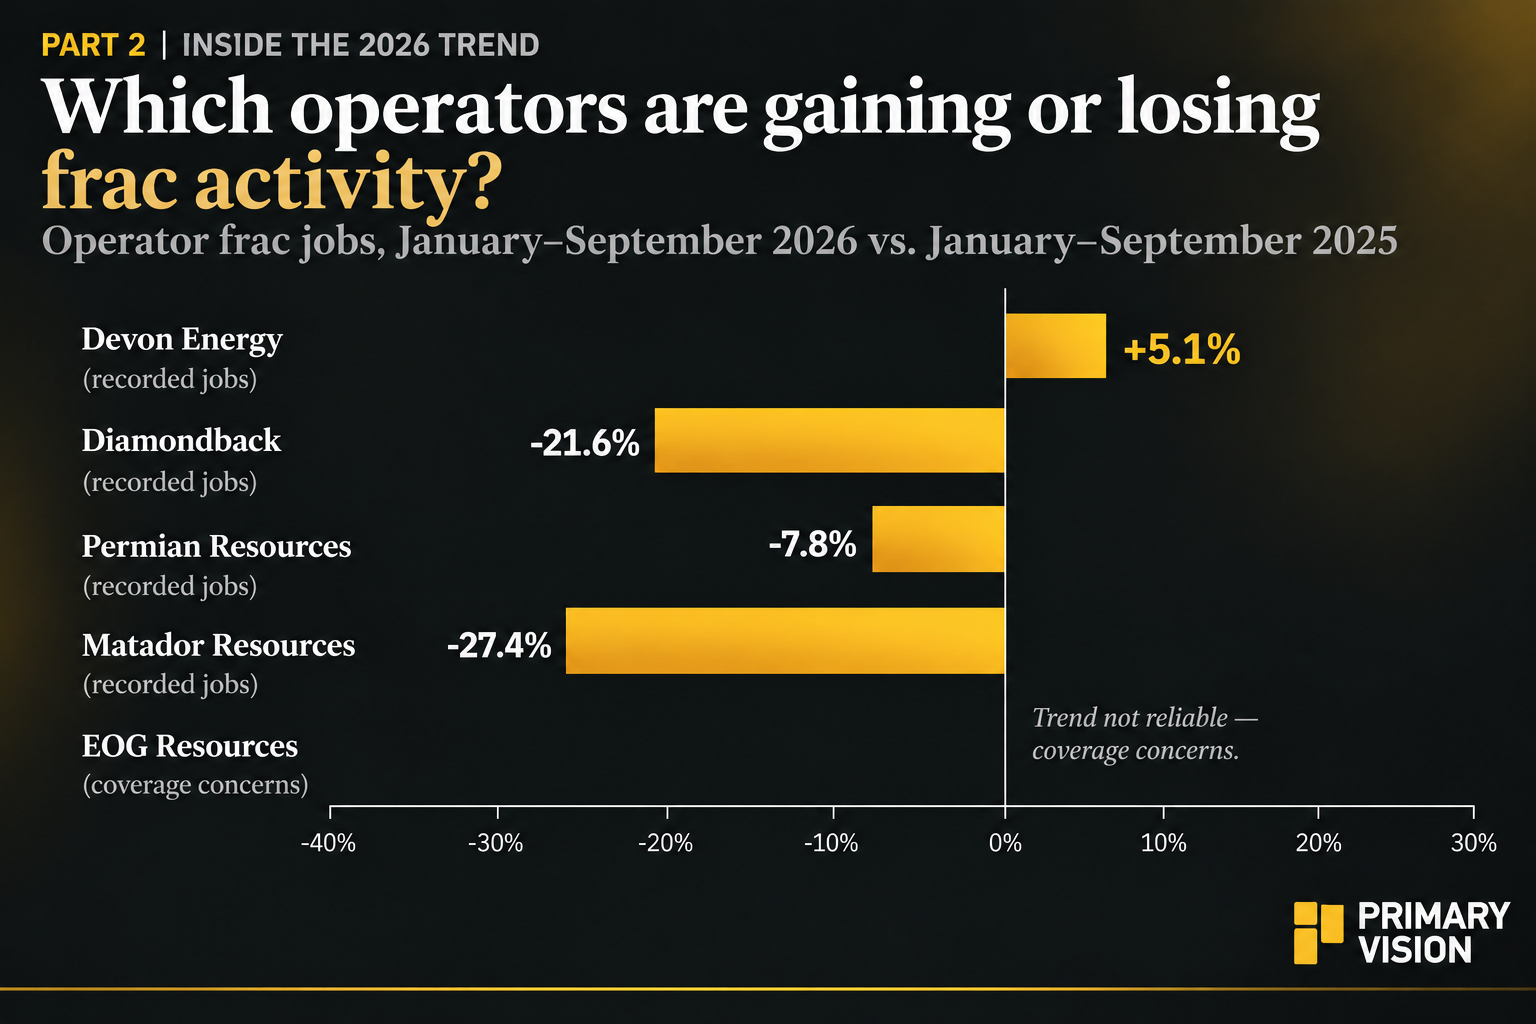
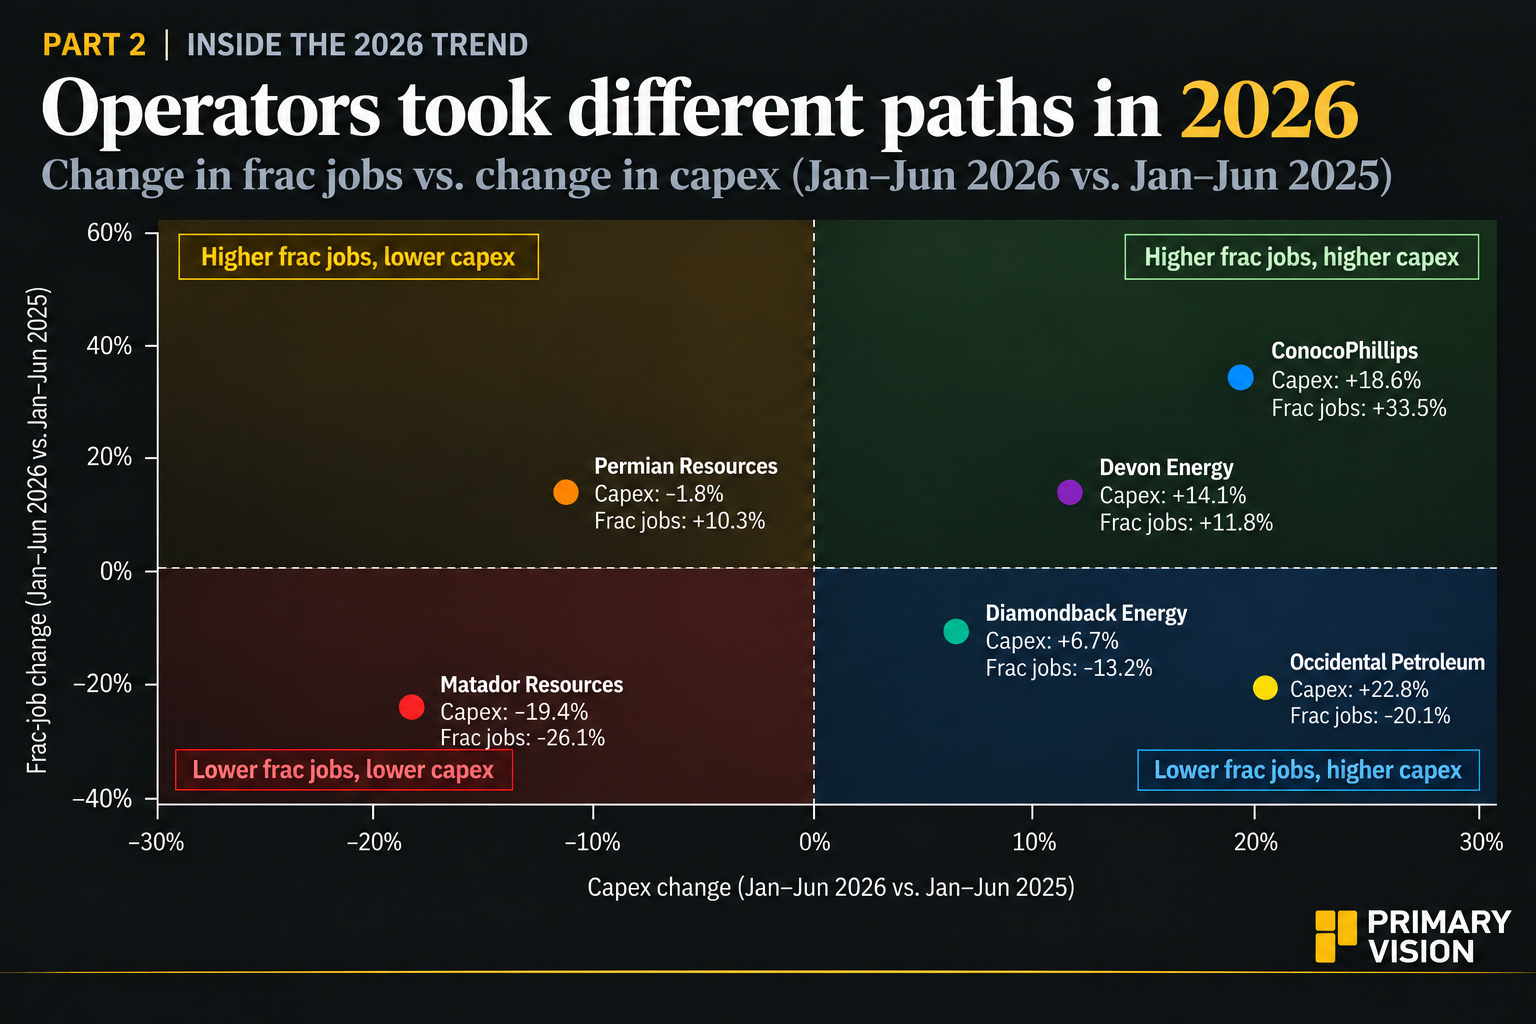
The operator-to-basin reconciliation shows that companies can move against the regional trend. In the Permian, regional FJC declined 15.6% in the first half of 2026, but Devon's recorded jobs increased 27.2%, Permian Resources rose 10.3%, and Matador edged up 2.9%. By contrast, Occidental's recorded jobs fell 18.8%.
This is the key divergence: a weaker basin does not necessarily mean every operator in that basin is reducing activity. Development schedules, acreage mix and completion priorities may help explain the differences, but job counts alone cannot establish the reason.
The pattern also varies by basin within the same company. Devon's recorded Permian jobs increased 27.2%, while its Western Gulf jobs declined 37.0%. Regional FJC fell 4.5% in the Western Gulf, making Devon's recorded decline substantially steeper than the basin trend. That gap warrants further investigation rather than an automatic conclusion about execution or efficiency.
These comparisons use January–June 2026 versus January–June 2025. Operator jobs are raw company-level counts, while regional FJC measures basin activity. Coverage limitations remain, and the figures should be treated as directional rather than as a ranking of operating performance.
What Could Explain the Divergence?
Capital allocation and operating strategy offer useful context for understanding differences between spending and frac activity. Devon has emphasized capital efficiency and free-cash-flow improvement. Permian Resources reduced the midpoint of its 2025 capital budget while maintaining production guidance, while ConocoPhillips cited Marathon synergies, operational improvements, and cost deflation in its Lower 48 spending plans.
These priorities help explain how operators approach capital allocation, but they do not establish why their frac-job counts changed in 1H 2026. That requires comparing spending, completion activity, and production over the same period.
The Takeaway
Regional FJC and operator-level jobs tell different parts of the story. Haynesville is moving against the broader regional trend, while some Permian operators are increasing recorded activity despite a basin-wide decline.
The next question is not simply who is doing more jobs, but whether those changes align with capital plans and operating outcomes. Frac-job counts identify the divergence; comparable spending and production data are needed to explain it.
Upgrade to Pro Today and get…
• This article — plus dozens more each month, all within our full Research Module
• Frac Hits — our National-Level Frac Spread Count and Frac Job Count, updated weekly
• Frac Operator Monitor — detailed FSC & FJC by operator
• And so much more, designed to help you track, forecast, and outperform