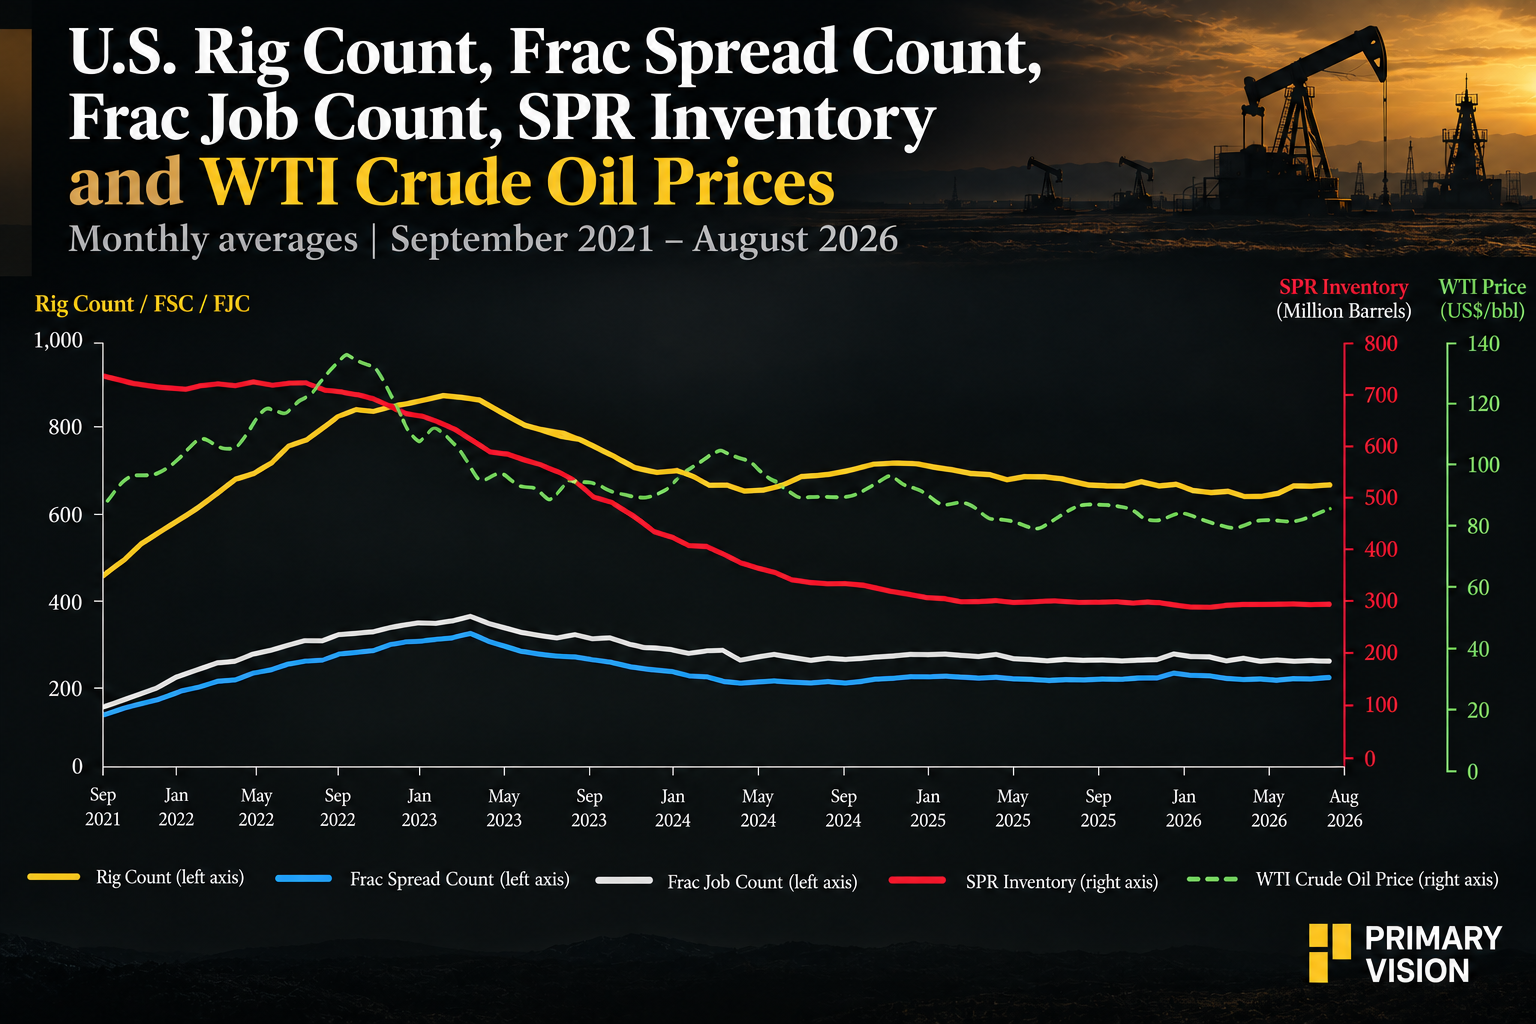
An SPR barrel already exists. A new shale barrel requires capital, drilling, completion and time. That creates a transmission chain:
The direction does not necessarily run from the SPR to frac activity. The timing is more informative than a simple comparison of levels because government policy and producer activity can respond to the same oil-market conditions.
Weekly Data Show No Direct Connection
At the weekly level, there is essentially no relationship. Week-over-week changes in Primary Vision’s national FSC (Frac Spread Count) show no statistically meaningful correlation with SPR changes across the tested lags. The weekly data do not support the use of completion activity as an immediate signal for SPR movements.
The Monthly Picture Is Different
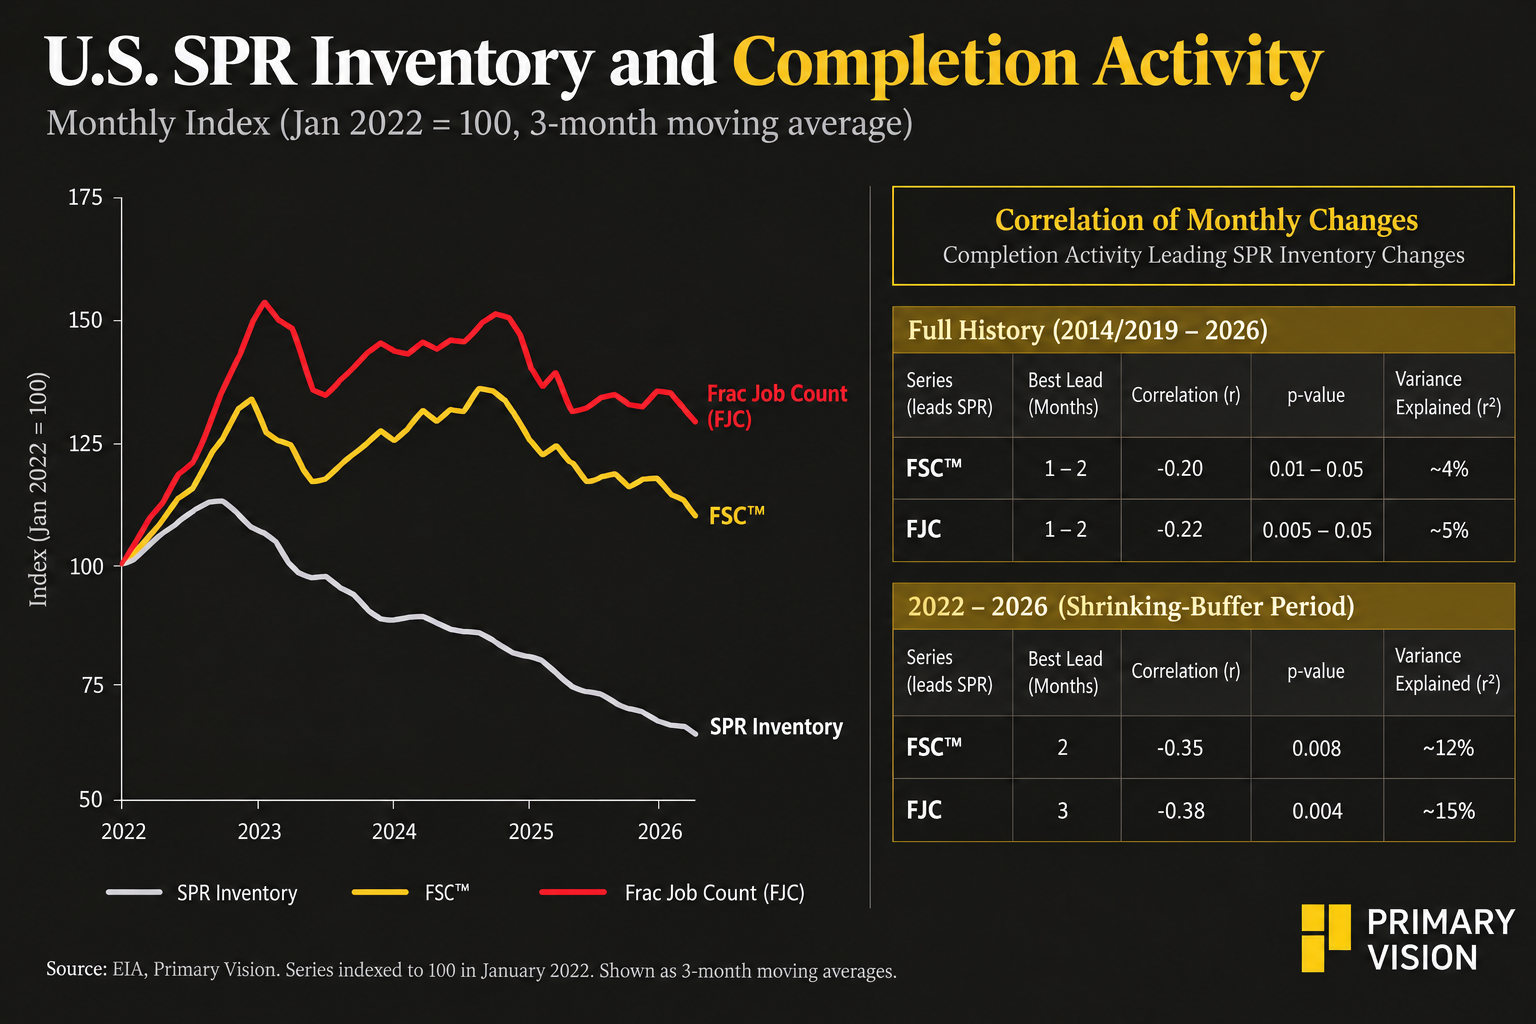
At a monthly frequency, FSC changes show a mild negative relationship with subsequent SPR changes across the full history, strongest at roughly a one-to-two-month lead. It is suggestive, but does not survive correction for the number of lags tested.
During 2022–2026, the relationship strengthens. FSC changes lead SPR changes by two months at the strongest point, with r = -0.35 and p = 0.008. Here, r = -0.35, which indicates a moderate negative relationship. The p-value of 0.008 indicates that this relationship is unlikely to have appeared by chance under the statistical test used.
The strongest basin relationships are in the Permian, Appalachian and Western Gulf. FSC changes lead SPR changes by one to two months, with r values of -0.28 to -0.32 and uncorrected p-values below 0.01. In fact, according to the correlation test, none of the basin-level relationships remains statistically significant.
The practical takeaway is easier to understand than the statistics: completion activity appears to move ahead of changes in SPR inventory by several months, particularly during the 2022–2026 period.
What Could Be Driving It?
The most plausible interpretation is not that frac activity mechanically causes SPR withdrawals. Stronger completion activity can reflect a supportive oil-price and investment environment, while the same environment can influence government decisions to draw down or rebuild the SPR. The two series may therefore respond to shared drivers with different timing.
The negative relationship is economically intuitive: stronger completion activity can coincide with a more active domestic supply cycle, while weaker activity can coincide with efforts to protect or rebuild the supply cushion.
What It Means for Investors
For pressure-pumping investors, the useful signal is not the SPR level itself. It is whether FSC moves in a sustained direction and whether that move is followed, after the observed lag, by a change in SPR policy.
A sustained increase in FSC alongside stronger oil-market economics would be worth watching as a potential precursor to larger SPR drawdowns. Conversely, weakening FSC followed by SPR stabilization or rebuilding would point in the opposite direction. The payoff is therefore not “SPR down = frac up.” Completion activity may contain information about the broader supply-and-policy cycle that eventually shows up in the SPR — with a lag and limits.
Upgrade to Pro Today and get…
• This article — plus dozens more each month, all within our full Research Module
• Frac Hits — our National-Level Frac Spread Count and Frac Job Count, updated weekly
• Frac Operator Monitor — detailed FSC & FJC by operator
• And so much more, designed to help you track, forecast, and outperform