In this part, we will identify the leading operators by county by frac job count.
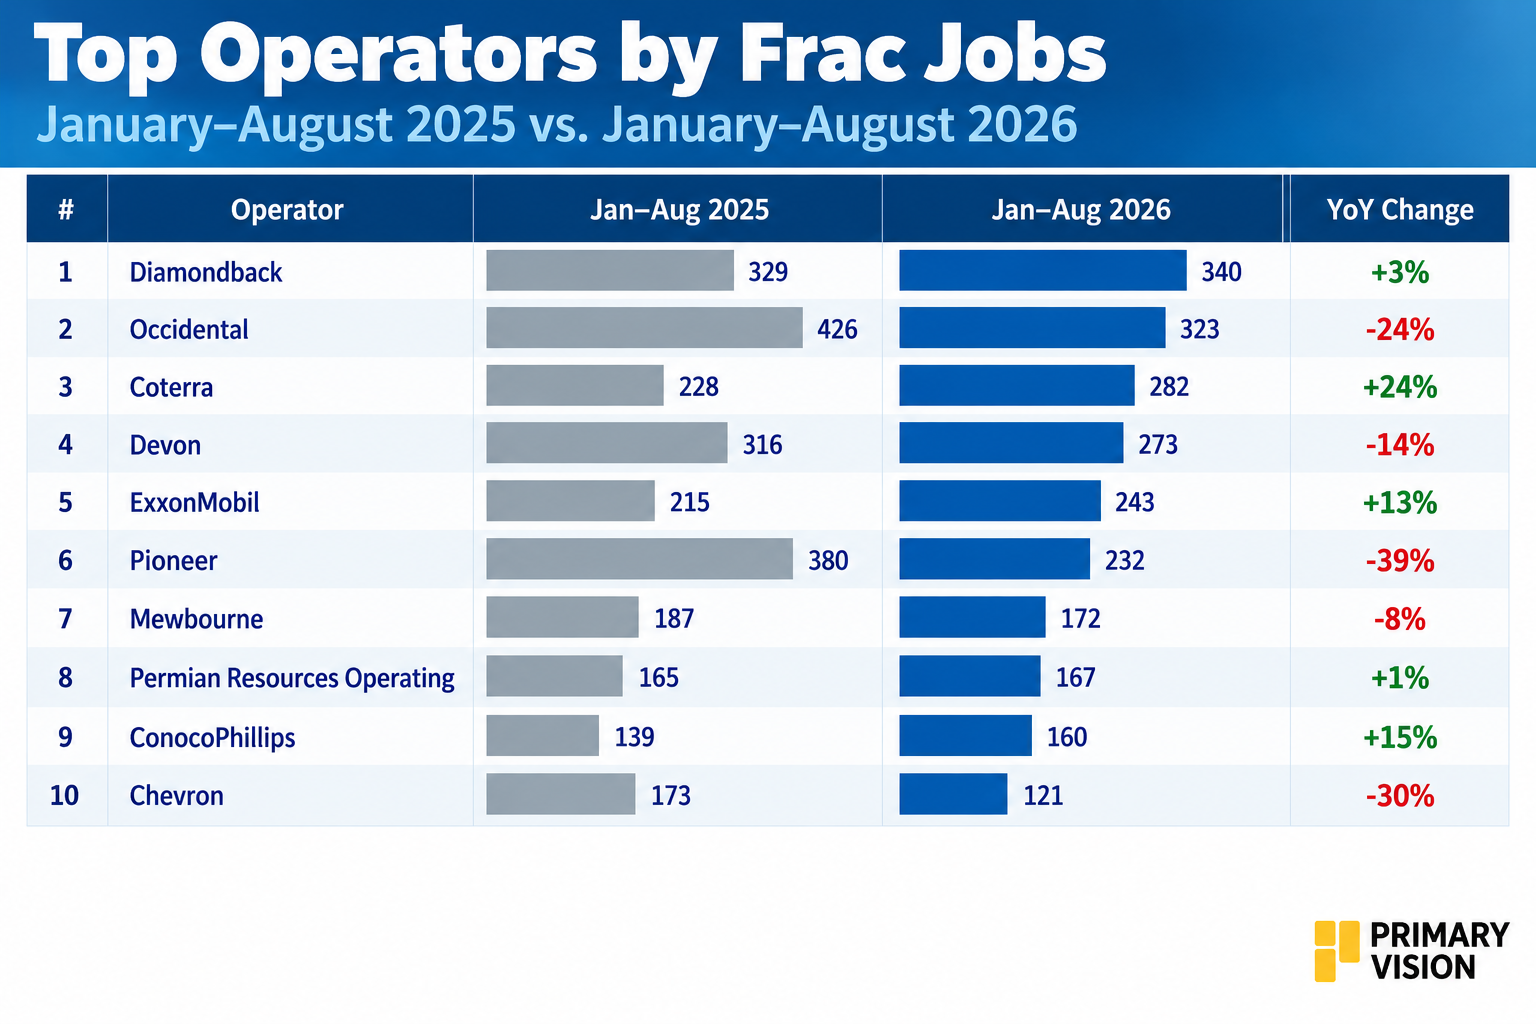
The operator data shows a clear concentration of frac activity among the largest participants. The top operators in the January–August 2026 dataset include Diamondback Energy, ConocoPhillips, Permian Resources and EOG Resources. All four increased their frac-job counts year over year.
Diamondback increased activity by about 3%, while ConocoPhillips was up roughly 2%. Permian Resources grew about 18%, and EOG increased about 8%.
The pattern changes further down the ranking. Devon fell about 14%, Occidental about 24%, Mewbourne about 8%, Pioneer about 39%, and Chesapeake about 30%. Coterra moved in the opposite direction, increasing about 24%.
This creates a wider spread between operators that are adding activity and those pulling back. The overall market declined, but the decline was not evenly distributed across the operator base.
The result is a more concentrated operator landscape even without a uniform increase in industry activity.
Operator Footprint And Activity Are Not The Same
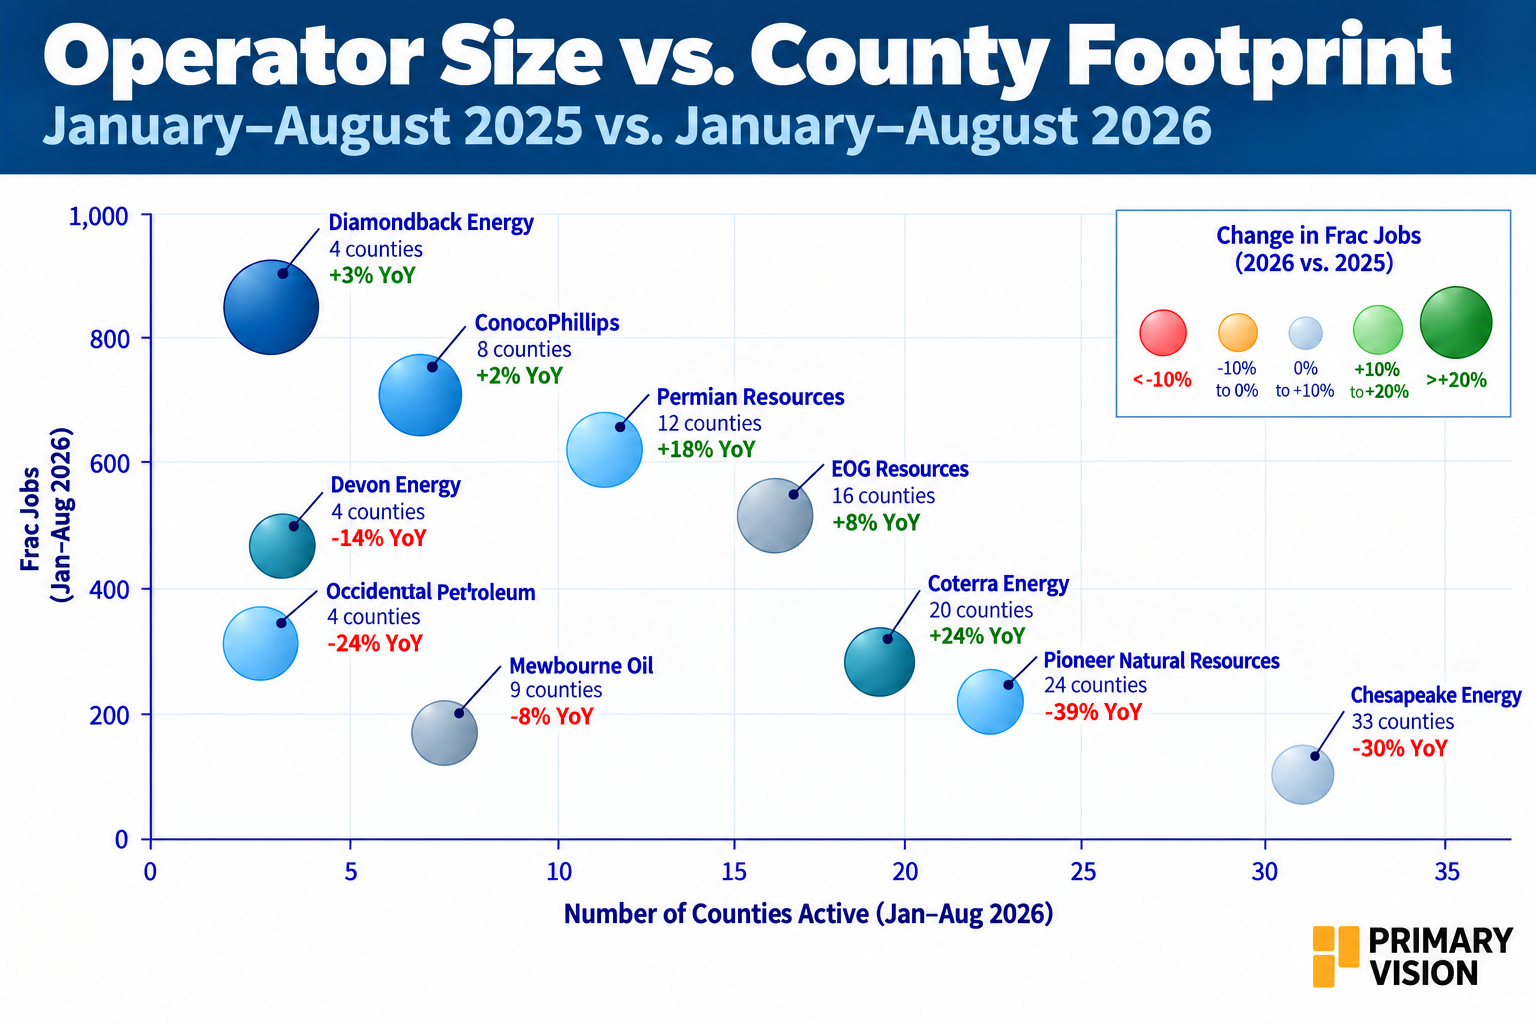
The operator footprint data adds another layer to the ranking. Diamondback generated the most frac jobs while operating across only about four counties in the tracked dataset. ConocoPhillips worked across roughly eight counties, while Permian Resources was active across about 12. EOG had a wider footprint of roughly 16 counties.
The difference becomes more visible among the lower-volume operators. Coterra worked across about 20 counties, while Pioneer and Chesapeake had footprints of roughly 24 and 33 counties, respectively. Their frac-job totals were much lower than the leading operators.
That means county footprint alone does not measure the intensity of an operator's activity. Some operators are concentrated in a smaller number of counties, while others spread activity across a much wider geography.
This distinction matters when comparing operators. A broad footprint can reflect participation across many markets without producing the same level of frac activity as a more concentrated operator.
Where Is Operator Leadership Shifting?
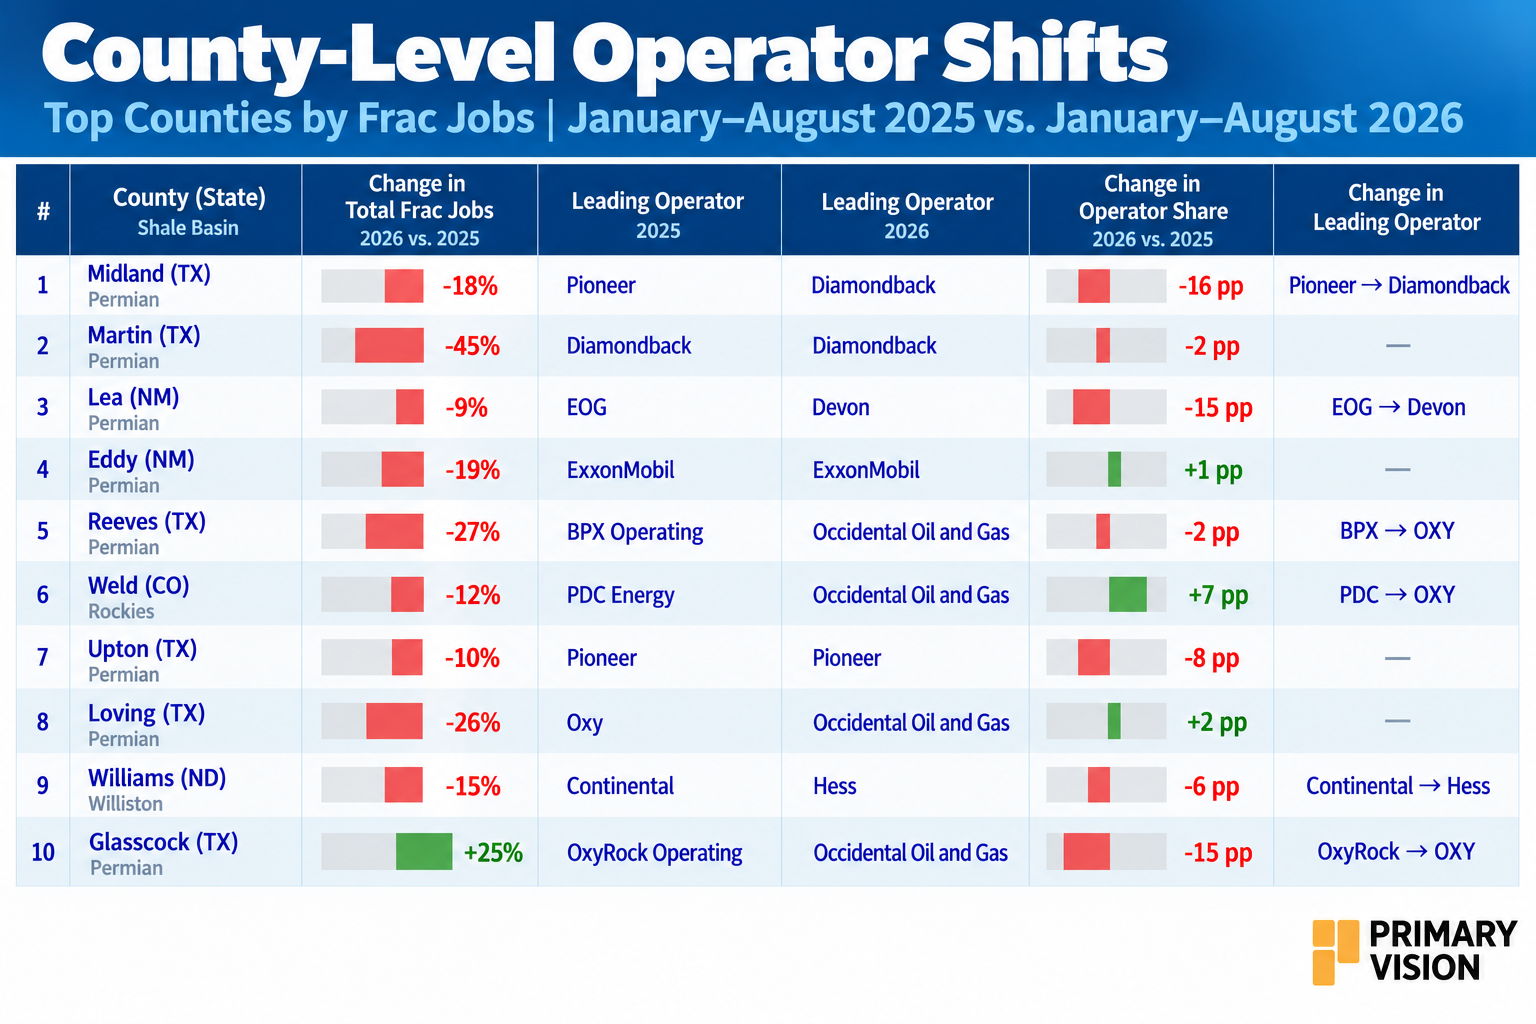
Lea is the clearest example. EOG led the county in 2025, but Devon became the leading operator in 2026. Midland also changed leadership, moving from Pioneer to Diamondback. Weld shifted from PDC Energy to Occidental, while Reeves moved from BPX Operating to Occidental.
Williams changed from Continental to Hess. In contrast, ExxonMobil remained the leader in Eddy, Diamondback remained the leader in Martin, Pioneer remained the leader in Upton, and Occidental remained the leader in Loving and Glasscock.
These changes do not necessarily mean that the underlying county market changed direction because of the operator switch. The database shows who led the activity; the reason for a leadership change requires separate company-level evidence.
What The Data Actually Shows
The operator data confirms that U.S. frac activity is concentrated, but the concentration is not static. The largest operators do not all move in the same direction, and county leadership can change even within the same core shale markets.
The broader picture is therefore more nuanced than a simple ranking of operators. Operator size reflects the amount of frac activity, while county footprint shows how broadly that activity is distributed. So, this article adds an operator layer to the county and proppant analysis.
Upgrade to Pro Today and get…
• This article — plus dozens more each month, all within our full Research Module
• Frac Hits — our National-Level Frac Spread Count and Frac Job Count, updated weekly
• Frac Operator Monitor — detailed FSC & FJC by operator
• And so much more, designed to help you track, forecast, and outperform