In Part 1 of the series, we discussed how completion activity is becoming more efficient, with operators generating more frac jobs from relatively stable deployed capacity. In Part 2, we discussed how weather can disrupt completion activity, but historical data suggests its effects are localized and short-lived.
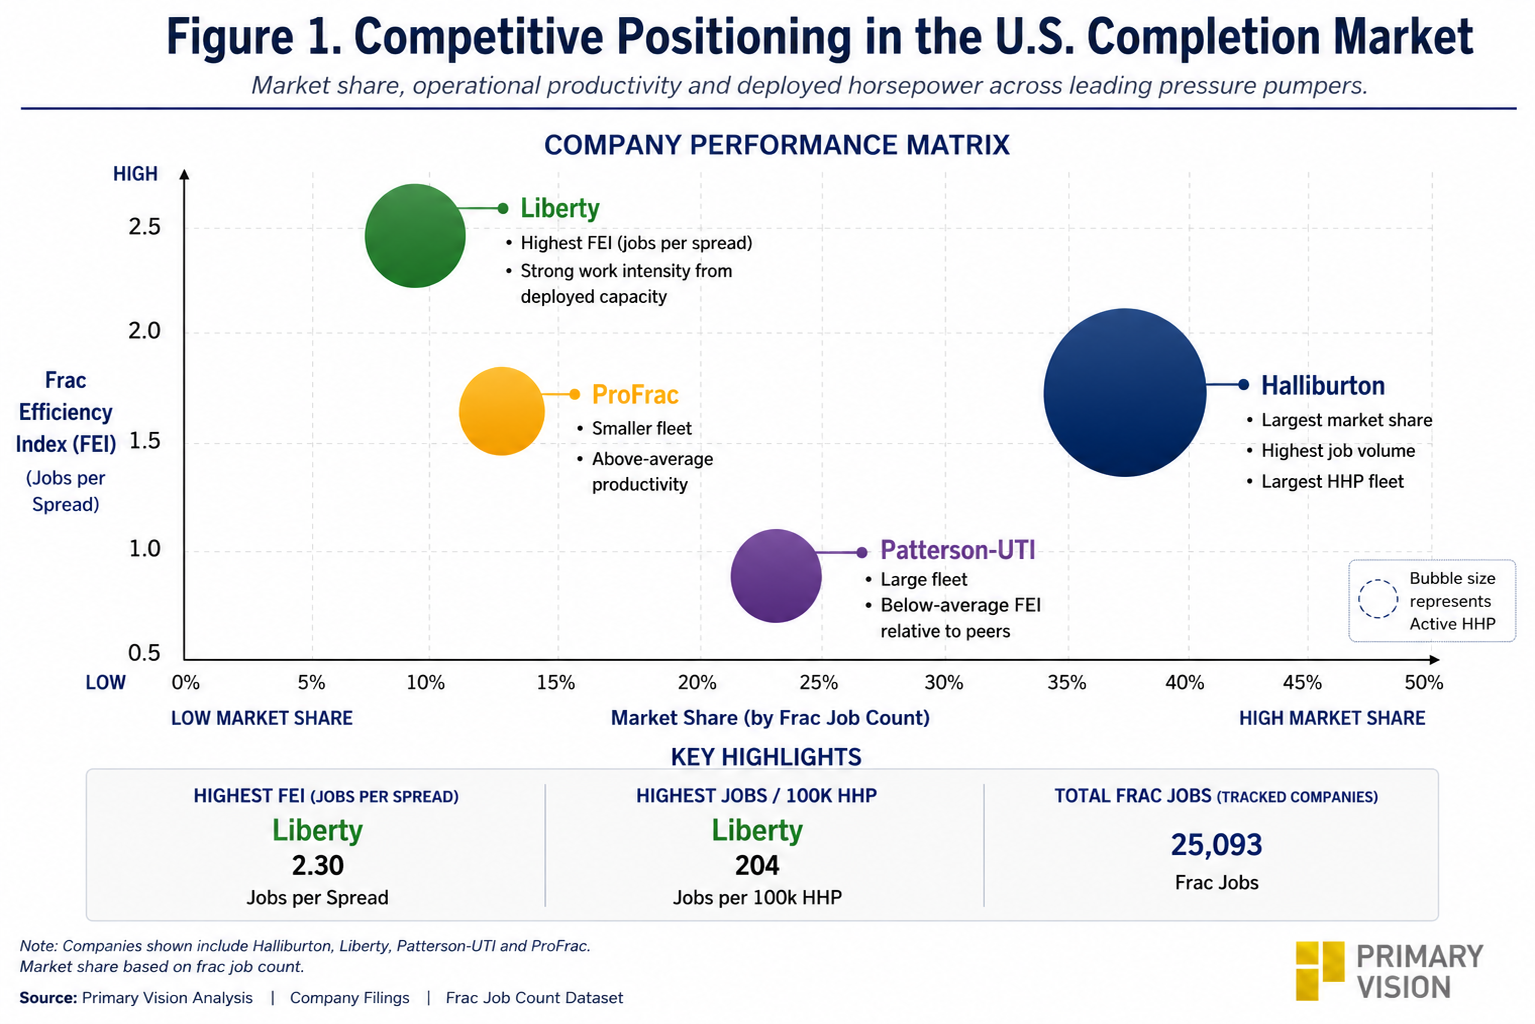
Figure 1 illustrates this distinction. Halliburton controls approximately 37% of tracked frac jobs and operates the industry's largest deployed horsepower fleet. Liberty, by comparison, accounts for only 22% of activity. Viewed through market share alone, Halliburton appears to hold a commanding lead. The productivity data tells a more nuanced story.
Frac Efficiency Separates Industry Leaders
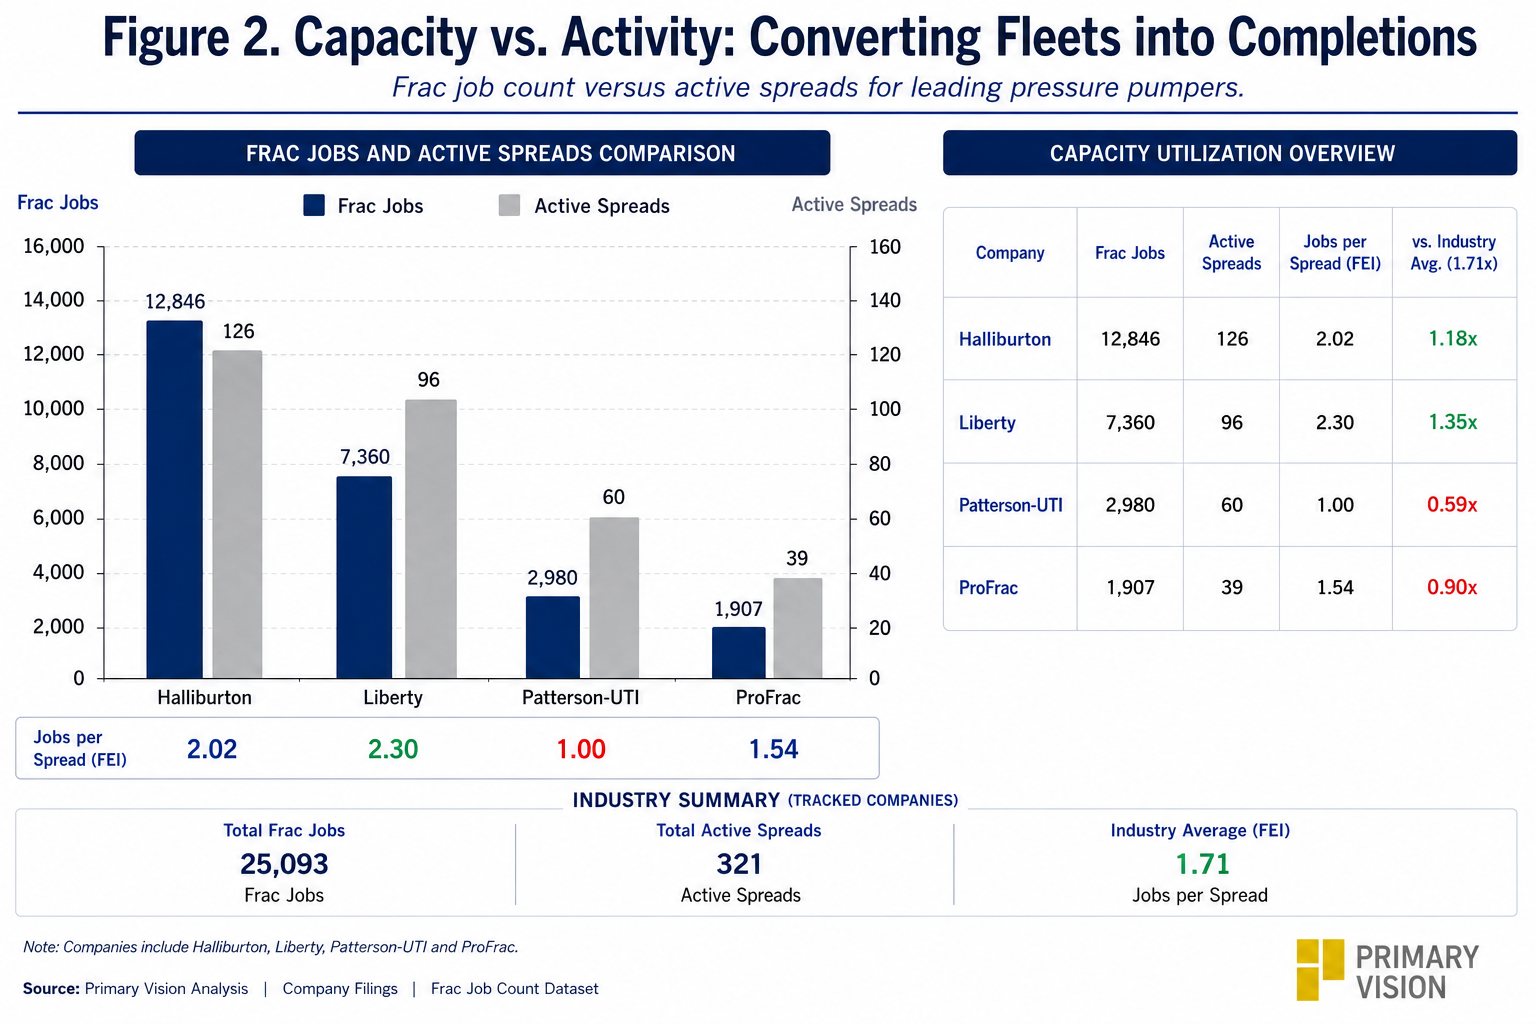
Comparing Frac Job Count with Active Spread Count reveals meaningful differences in operational performance. The four largest publicly tracked pressure pumpers completed 25,093 frac jobs using 321 active spreads, producing an industry-average Frac Efficiency Index (FEI) of 1.71 jobs per spread.
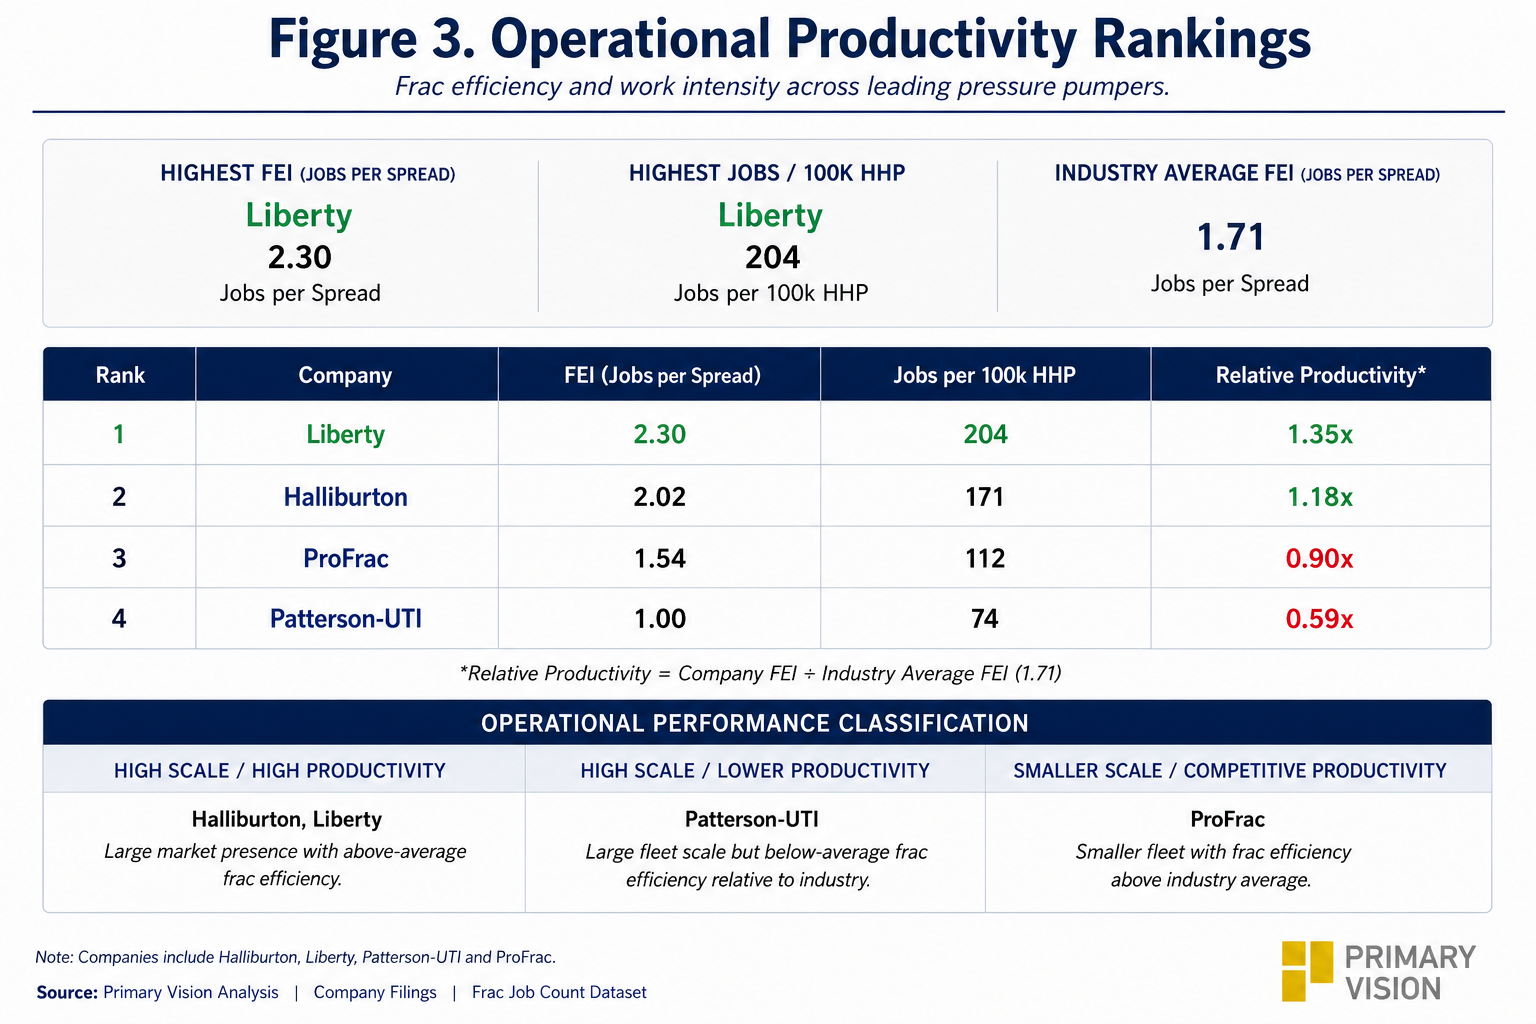
Liberty generated an FEI of 2.30, approximately 35% above the peer average and the highest among the companies analysed. Halliburton followed at 2.02, combining industry-leading scale with above-average productivity. ProFrac achieved 1.54, while Patterson-UTI averaged 1.00. The dispersion is significant: Liberty completed more than twice as many jobs per active spread as Patterson-UTI despite operating a similar type of business.
What Drives Operational Leadership?
Adding deployed horsepower reinforces the productivity gap. Liberty generated 204 frac jobs per 100,000 HHP, followed by Halliburton at 171, ProFrac at 112, and Patterson-UTI at 74. The rankings indicate that competitive positioning is increasingly influenced by how operators deploy horsepower rather than how much horsepower they own.
Basin Positioning and Fleet Strategy
Management commentary provides context for the rankings. Liberty's concentration in high-intensity Permian development, supported by electric and Tier IV dual-fuel fleets, aligns with its industry-leading FEI.
Halliburton prioritizes broad basin coverage and market leadership, trading some average productivity for scale. ProFrac benefits from concentrated deployment in high-intensity unconventional programs. Patterson-UTI's broader basin exposure and more diversified fleet mix weigh on fleet-wide FEI.
Investor Takeaway
The data highlights three conclusions: scale still matters, productivity increasingly differentiates operators, and basin exposure and fleet mix help explain performance differences. Market share identifies industry presence, but Frac Efficiency Index provides a better measure of operational leadership.
The comparison also shows that efficiency is not determined by fleet size alone, but by how equipment is deployed against the underlying completion workload. As the market becomes more productivity-driven, investors should increasingly evaluate where fleets operate and how effectively they convert deployed horsepower into completed work.
Upgrade to Pro Today and get…
• This article — plus dozens more each month, all within our full Research Module
• Frac Hits — our National-Level Frac Spread Count and Frac Job Count, updated weekly
• Frac Operator Monitor — detailed FSC & FJC by operator
• And so much more, designed to help you track, forecast, and outperform