

Articles
- BLOG / Articles / View
- Articles
OFS Ranking Index: Visibility and Strategic Positioning Drive Q1 Separation
By Avik on June 18, 2026 in Articles
OFS Industry Is Changing Faster Than Rankings
The OFS sector entered 2026 expecting oversupply, cautious customer spending, and another year of subdued activity. By the end of the first quarter, that narrative had shifted. Energy security concerns, Middle East supply disruptions, improving offshore visibility, and tightening premium pressure-pumping capacity have begun to reshape industry expectations.
While the rankings themselves changed little, the underlying scores reveal a growing separation between companies benefiting from long-duration visibility and strategic diversification and those still dependent on a cyclical recovery. The Q1 2026 OFS Ranking Index captures that divergence and highlights the value drivers increasingly determining leadership across the sector.
Methodology and Category Leaders
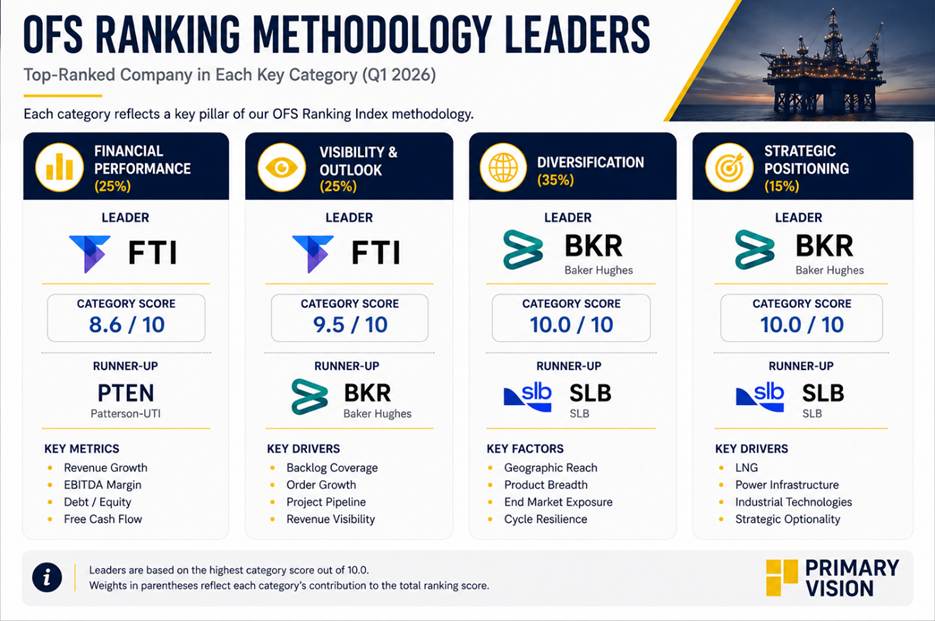
The OFS Ranking Index evaluates companies across four categories:
Financial Performance
Visibility & Outlook
Diversification
Strategic Positioning
Q1 2026 rankings are compared against a restated Q4 2025 baseline using the same methodology. This allows score changes to reflect actual shifts in positioning rather than changes in the framework.
Baker Hughes Remains the Benchmark
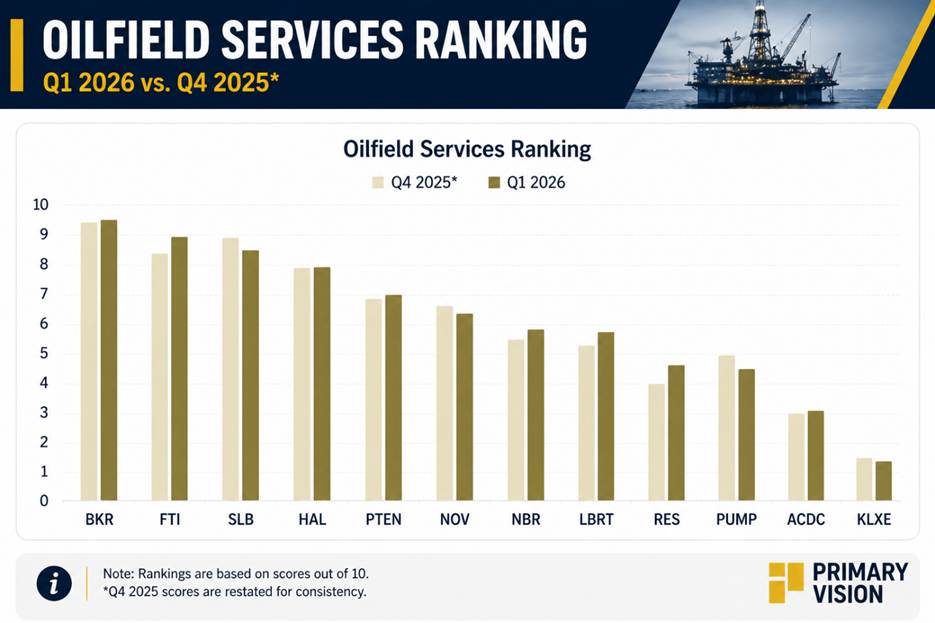
Baker Hughes retained the highest score in the ranking universe, improving from 9.30 to 9.43. The company’s leadership continues to be driven by diversification rather than pure financial performance. LNG infrastructure, gas compression, power generation, carbon capture, and traditional oilfield services collectively provide a level of visibility unmatched by peers.
Recent LNG awards, power-related contracts, and continued strength in Industrial & Energy Technology support a durable earnings profile. While some OFSE markets remain challenged, Baker Hughes continues to benefit from multiple long-cycle growth drivers that strengthen its strategic position.
FTI Delivered the Strongest Q1
TechnipFMC recorded the largest score increase in the universe, improving by 0.63 points. The primary driver was visibility. Subsea order activity remained strong, the opportunity pipeline expanded to approximately $30 billion, and management indicated that roughly 95% of expected 2026 revenue is already covered by backlog. The increasing adoption of Subsea 2.0 continues to improve project economics while supporting longer-duration earnings visibility. The result is a narrowing gap between TechnipFMC and Baker Hughes, highlighting the growing importance of offshore exposure within the ranking framework.
SLB and HAL Move in Different Directions
SLB’s score declined by 0.41 points despite retaining one of the strongest strategic positions in the industry. The company continues to benefit from digital technologies, production systems, ChampionX integration, and international diversification. However, weaker visibility and increased uncertainty related to Middle East disruptions weighed on its score.
Halliburton remained unchanged at 7.93. The company continues to benefit from strong international operations and improving North American completions fundamentals. However, visibility improvements lagged those seen at Baker Hughes and TechnipFMC, resulting in a stable rather than improving score.
PTEN Leads the Pressure Pumpers
PTEN remained the highest-ranked pressure pumper, improving from 6.88 to 7.00. Management highlighted near-full utilization of natural gas-powered fleets and improving completion market conditions. The company continues to prioritize premium equipment while limiting exposure to lower-return legacy horsepower. Tightening completion capacity and growing demand for high-spec assets improved PTEN’s visibility profile during the quarter. Read more about pressure pumpers in our latest article.
LBRTand RES Improved
Liberty and RPC were among the strongest movers in the ranking. Liberty improved by 0.45 points as pressure pumping fundamentals stabilized and confidence increased in the company’s power solutions platform. Its long-term distributed power strategy provides an increasingly important source of strategic differentiation.
RPC improved by 0.57 points, one of the strongest gains in the ranking universe. The company continues to prioritize returns and utilization rather than reactivating idle capacity. Growing adoption of proprietary technologies within Thru Tubing Solutions further strengthened its position.
NOV and PUMP Lost Ground
NOV declined by 0.15 points during the quarter. While management remains constructive on the industry outlook, logistics disruptions, delayed deliveries, and higher freight costs negatively impacted visibility and near-term execution.
ProPetro recorded the largest decline in the ranking, falling 0.50 points. The company continues to make progress through PROPWR and next-generation fleet deployment. However, weaker visibility and lower diversification relative to peers offset the benefits of tightening pressure pumping fundamentals.
Relative valuation
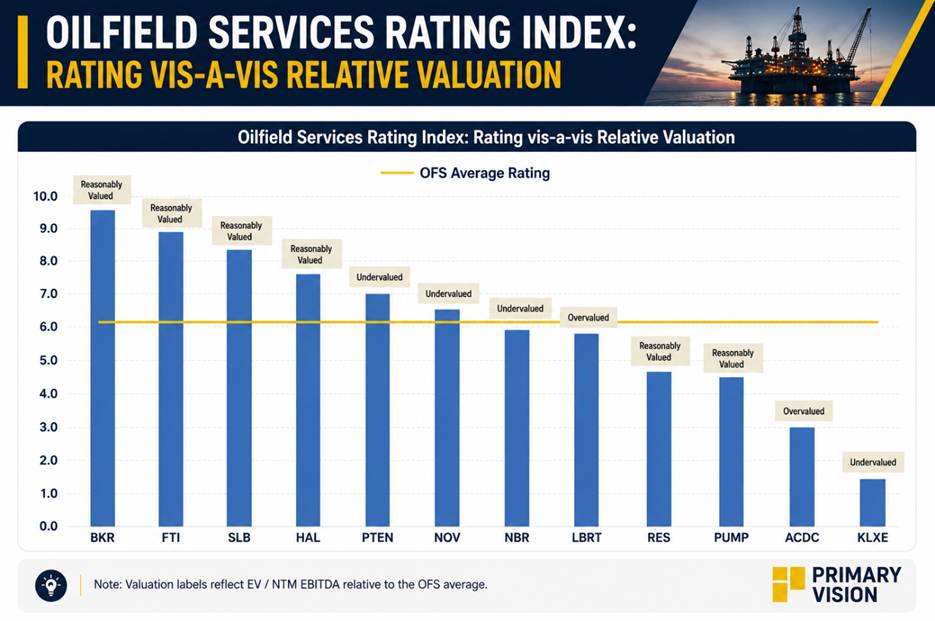
Relative valuation remains broadly balanced across the sector. PTEN, NOV, NBR, and KLXE appear undervalued based on their ranking scores, while Baker Hughes, TechnipFMC, SLB, Halliburton, RPC, and ProPetro appear reasonably valued. Liberty and ProFrac screen as relatively overvalued, reflecting higher expectations already embedded in their multiples. Overall, valuation dispersion remains moderate, with no extreme outliers across the OFS universe.
Key Takeaway
Baker Hughes maintained its leadership position, while TechnipFMC delivered the strongest improvement during the quarter. Patterson-UTI, Liberty, and RPC also strengthened their standing as pressure pumping fundamentals improved.
The Q1 2026 ranking highlights an increasingly important trend within the OFS sector. The strongest score improvements occurred among companies with long-duration backlog visibility, offshore exposure, diversified revenue streams, and emerging participation in power infrastructure markets.
Tags:
Permission denied
Upgrade to Pro Today and get…
• This article — plus dozens more each month, all within our full Research Module
• Frac Hits — our National-Level Frac Spread Count and Frac Job Count, updated weekly
• Frac Operator Monitor — detailed FSC & FJC by operator
• And so much more, designed to help you track, forecast, and outperform


